
SLIDE 1
EEC Q3 Investor Presentation Page 1 DISCLAIM DI IMER ER This - - PowerPoint PPT Presentation
EEC Q3 Investor Presentation Page 1 DISCLAIM DI IMER ER This presentation (Presentation) has been prepared by Emaar the Economic City (EEC) and/or its subsidiaries based on information available to it internally and third party sources.
third party sources. This Presentation does not purport to contain all the information that a prospective investor may require in connection with any potential investment in EEC. You should not treat the contents of this Presentation, or any information provided in connection with it, as financial advice, financial product advice or advice relating to legal, taxation or investment matters. No representation or warranty is made by EEC or any of its advisers, agents or employees as to the accuracy, completeness or reasonableness of the information in this Presentation or provided in connection with it. No information, including but not limited to numbers, maps, drawings, or maps contained in this Presentation or any other written or oral communication in connection with it is, or shall be relied upon as, a promise or representation and no representation or warranty is made as to the accuracy or attainability of any estimates, forecasts or projections set out in this
for any loss or damage suffered or incurred by you or any other person or entity however caused (including, without limitation, negligence) relating in any way to this Presentation including, without limitation, the information contained in or provided in connection with it, any errors or omissions from it however caused (including without limitation, where caused by third parties), lack of accuracy, completeness, currency or reliability or you, or any other person or entity, placing any reliance on this Presentation, its accuracy, completeness, currency or reliability. EEC does not accept any responsibility to inform you of any matter arising or coming to EEC’s notice after the date of this Presentation which may affect any matter referred to in this Presentation. Any liability of EEC, their advisers, agents and employees to you or to any other person or entity arising out of this Presentation including pursuant to any applicable Saudi law is, to the maximum extent permitted by law, expressly disclaimed and excluded.
and any other persons who come into possession of this Presentation must inform themselves about, and observe any such restrictions.
strategy and prospects may or may not be achieved. They are based on certain assumptions, which may not be met or on which views may differ and may be affected by known and unknown risks. The performance and operations of EEC may be influenced by a number of factors, many of which are outside the control of
expectations or plans will be achieved either totally or partially or that any particular rate of return will be achieved. Given the risks and uncertainties that may cause EEC’s actual future results, performance or achievements to be materially different from those expected, planned or intended, Recipients should not place undue reliance on these intentions, expectations, future plans, strategy and prospects. EEC does not warrant or represent that the actual results, performance or achievements will be as expected, planned or intended.
Page 1
A N New Global bal Hub
Establish King Abdullah Economic City (KAEC) as a strong enabler
Page 2
Page 3
Segment ent Breakd akdow
Categor
Current ent Plan
Industrial 23,625,000 Commercial/Hospitality 12,736,000 Residential 75,373,000 Other 19,847,000 BUA Total l 131,58 581,000 00 Employment 890,000 Population 1,750,000 Industrial 21% Retail 11% Residential 68%
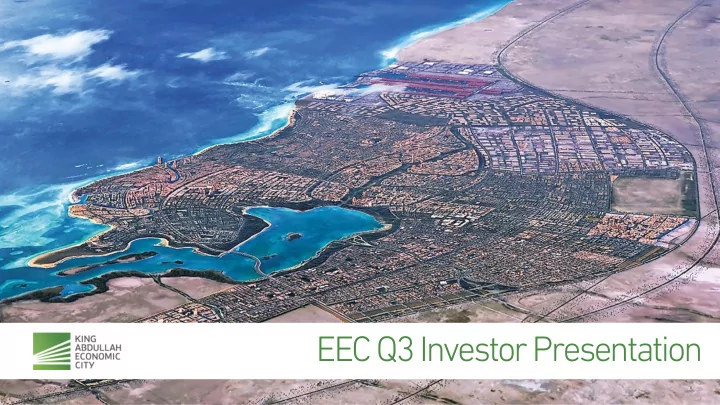
KAEC is a greenfield city development roughly the size of Washington DC. Its objective is to help with Saudi Arabia’s acute housing demand and support economic diversification. KAEC’s strategic location
maritime routes and provides instant access to key cities within Saudi Arabia. KAEC is comprised of the Coastal Communities, The Industrial Valley, King Abdullah Port( KAP), and The Hejaz District.
Proje ject Overview view
Page 4
COMMERCIAL L & LIESURE
CITY DEVELOP LOPMENT NT & ECON ONOM OMIC GROWTH
CITY DRIVE VERS
Babson College) INFRA-ST STRUCTURE
SOCIAL AMENITIES
HOUSING G NEEDS DS
Land/U d/Unit nit Sale les Debt Shareh ehold
ers s Equ quit ity
Fundin ing g Source ces
Retu turn to Share- holde ders s Fin. . benefit efits s to Govt. t. Local l & Foreign eign Inv. . Logistics istics Hub Realizat lizatio ion n of Econom
ic city y visio ion n Job Crea eation tion
Page 5
Page 6
Page 7
Completed Development Under Development
Current nt On Completion letion
For more info, please visit KAP’s website: https://www.kingabdullahport.com.sa/
Page 8
MBSC is operated by Babson Global Programs Offered: Undergraduate degrees focusing on Business and Entrepreneurship; Graduate MBA degree; and Executive & Continuing Education For more info, please visit MBSC’s website: http://mbsc.edu.sa/
Page 9
College, USA), Lockheed Martin under the umbrella of the Economic Offset Program in the Kingdom of Saudi Arabia and the MISK foundation
For more info, please visit KAEC’s website: http://www.kaec.net/live/
Page 10
Fully operational since Q3 - 2014 Grades Offered: Nursery up to Grade 12 Current Enrolment: Over 500 students
For more info, please visit KAEC’s website: http://www.kaec.net/live/
Page 11
For more info, please visit Bay La Sun hotel’s website: http://www.baylasunhotel.com
Page 12
Recipient of 2016 World Travel’s Saudi Arabia’s Leading Business & Leisure Hotel Award
For more info, please visit KAEC’s website: http://www.kaec.net/live/
Page 13
For more info, please visit Royal Greens’ s website: http://royalgreens.kaec.net/
Page 14
clubs, BBQ grills, juice bars, and conference rooms
To be launched in the next few months
For more info, please visit KAEC’s website: http://visit.kaec.net/discover/facilities/karting
Page 15
Our newly laid track is 700m long and 7 to 10 m wide; it consists of a variety of fast straights, long fast corners and a good mixture of slower corners (9 in total) to really test
beginner right through to the most experienced!
Page 16
multipurpose courts for Basketball, Badminton, Tennis, Squash and Volleyball, men and women pools, Gymnasium, Fitness rooms, Aerobic Halls and Spinning, Jogging Track, Spa, Bowling Alley, Billiard and Snooker rooms, Rock climbing wall, Café, lounges and Seminar rooms
Page 17
Page 18
Page 19
4.5 m Residents
1.3 m residents
0.3 m consumers
KAUST& Thuwal Rabigh
120k residents 40k residents
55 minutes 25 minutes 30 minutes
2.5 m residents
*According to a news article by Saudi Gazette published on November 5, 2016.
Page 20
Page 21
Page 22
Page 23
Page 24
Q4 2015 2015 Q3 2015 Q2 2016
Revenue Net Income Gross Profit
230 100 80 Q3 2016 332 22
132 52
Q1 2016 489 75 419 116 41 120 Residential Development Industrial Valley Commercial Development Other Income Order Intake Revenue RD 60% IV 17% Commercial 6% Other Income 17%
Total al 696 SARs
Order Intake and Revenue YTD 2016 % Breakdown of
(SARS M)
169 85 8.1 386 176 158 *Other Income: Constitutes value added services, service charges, and income from education
Page 25
1057 1396 1218 760 307 112 116 535 R.Vertical R.Land IV Land Sales PDC Land Total Units
Number ber of Units (Full ll Valu lue) Total al Area ea (M2 ‘000)
234 1767 8,763 11,609 22,373 64 63 316
R.Vertical R.Land IV Land Sales PDC Land Total Area
Sale les s Valu lue (SAR R M) Reve venue nue (SAR R M)
1,567 2,744 49 1 407 111 4 522 R.Vertical R.Land IV Land Sales PDC Land Total Units PJTD YTD
1,355 2,632 2,407 760 7,154 352 137 75 564
R.Vertical R.Land IV Land Sales PDC Land Total SV PJTD YTD PJTD YTD PJTD YTD
Page 26
4,361 4,431
Ticker Description: SASEIDX Index: Tadawul all share index SASEREAL Index: Tadawul all share real estate development industries index EMAAR AB Equity: Emaar Economic City’s stock on Tadawul
One year chart from November 2015 to November 2016: EEC has out performed both the Saudi Stock Exchange and the Local Real Estate Index
Page 27
Page 28
Sales GP RE RE Land Vertic ical l (exclu ludi ding ng Lease) e)
352
Total l area sold Gross s Margin
137 110
65,000 0 SQM 63,000 0 SQM
98% (SAR)
Revenu enue e
307 112
Page 29
Strong g presales esales growth h at 79.95% .95% CAGR GR from 2012 012-20 2015 15 drive ven by:
demand of over 1M houses to meet market needs.
Growth th in Vertica tical l Devel evelopme
t by 395% 5% since e 2013 13; ; Growth h in Land nd Develop evelopment ent by 37% % CAGR R since ce 2013 13
development segment
TG4, TG3, TG1.3, GC1c, GC3 Paymen yment t plan: 60 months hs of install tallmen ents ts for land and vertical ical with th a d down payment ment of 10% % for land and 20% % for vertic ical al
Page 30
Product 2012 2013 2014 2015 Vertical Net Order Intake (in million, SAR) 21 9 272 369 Units 12 6 178 641 Land Net Order Intake (in million, SAR) 167 673 655 776 Units 136 403 819 912 Totals Net Order Intake (in million, SAR) 188 682 927 1,149 Units 148 409 997 1,767
Bench Mark Analysis ysis Jeddah dah vs. KAEC* C*
4,489 3,746 4,807 3,583 - 4500 5,700 10,160 Affordable Housing Medium Income Housing High Income Housing KAEC Jeddah
SAR/SQM
Page 31
% Presales
(Sold and Reserved)
% Unsold % Lease
Sold 91% Unsold 9%
%Sold d Land d Sales es
Sold 58% Unsold 42%
%Sold d Vertic ical al Devel elopmen pment Sales es
99% 98% 78% 99% 58% 100% 98% 96% 91% 86% 99% 1% 2% 22% 1% 42% 0% 2% 4% 9% 14% 1% 103 392 156 91 219 145 279 505 410 504 253 BC1 BC2 BC3 GC1 GC3 Al Talah 1.1 Al Talah 1.2 Al Talah 3 Al Talah 4 Al Talah 5 TH4 Total Released Units
Residential Land Sales Summary
Page 32
66% 61% 11% 78% 21% 86% 27% 100% 23% 24% 51% 100% 100% 18% 82% 0% 20% 17% 67% 13% 65% 53% 4% 3% 34% 19% 89% 5% 12% 1% 8% 24% 72% 46% 0% 0% 82% 18% 990 388 57 116 116 192 192 116 116 144 76 5 12 147 179 Al Shurooq Al Waha Apartments Al Waha 1B Beach 1 Beach 2 Marina 1 Marina 2 Marina 3 Marina 4 Al Waha (Town House) Al Waha (Villa) BC1 Villa GC1C Villa GC2 Al Talah 1.3 Total Released Units
Residential Vertical Sales Summary
%Sold %Sold %Leased %Unsold
*Sellable area: total area sold plus area to be launched/sold
Page 33
Al Shurooq Apartment Al Shurooq Affordable 990 450 135,064 4,489 80% Launched Al Waha Apartment Waha Medium Income 388 .- 42,718 5,948 84% Launched Al Waha 1B Apartment Waha Medium Income 57 315 33,708 12.5% Launched Beach 1 Apartment BLS High Income 116 .- 21,490 12,374 100% Launched Beach 2 Apartment BLS High Income 116 .- 21,684 13,200 100% Launched Marina 1 Apartment BLS High Income 192 .- 21,096 12,291 100% Launched Marina 2 Apartment BLS High Income 192 .- 21,058 12,108 100% Launched Marina 3 Apartment BLS High Income 116 .- 21,401 5,467 100% Launched Marina 4 Apartment BLS High Income 116 .- 21,498 12,066 100% Launched Al Waha (Town House) Town House Waha Medium Income 144 .- 34,565 4,735 100% Launched Al Waha (Villa) Villa Waha Medium Income 76 .- 6,597 8,364 100% Launched BC1 Villa Villa Al Muroj High Income 5 .- 11,803 5,190 100% Launched GC1 Villa Villa Al Muroj High Income 12 .- 7,567 4,995 100% Launched GC2 Villa Al Muroj High Income 147 .- 126,382 5,375 61% Launched Al Talah 1.3 Villa Al Talah Medium Income 179 .- 67,225 5,950 57% Launched Coastal Towers Apartment BLS High Income TBD TBD TBD TBD TBD Not Launched Al Talah 3 villas Villa Al Talah Medium Income
TBD TBD TBD Not Launched Al Talah 4 & 5 villas Villa Al Talah Medium Income TBD TBD 105,000 4,988 TBD Not Launched TH2 villas Villa Al Muroj High Income TBD TBD 48,830 7,757 TBD Not Launched Vertical Projects 2,846 824 747,687 7,831 BC1 Land Al Muroj High Income 103 .- 215,946 1,512 100% Launched BC2 Land Al Muroj High Income 392 .- 452,744 2,023 92% Launched BC3 Land Al Muroj High Income 156 64 196,520 2,714 70% Launched GC1 Land Al Muroj High Income 91 .- 82,947 1,250 87% Launched GC3 Land Al Muroj High Income 219 16 182,514 1,616 78% Launched TH4 Land Al Muroj High Income 253 .- 114,843 1,514 55% Launched Al Talah 1.1 Land Al Talah Medium Income 145 .- 63,094 657 0% Launched Al Talah 1.2 Land Al Talah Medium Income 279 .- 148,628 691 92% Launched Al Talah 3 Land Al Talah Medium Income 505 129 357,784 940 52% Launched Al Talah 4 Land Al Talah Medium Income 410 115 215,673 1,400 65% Launched Al Talah 5 Land Al Talah Medium Income 504 125 268,650 1,400 65% Launched GC4 Land Al Muroj High Income .- .- 168,475 1,450 53% Not Launched GC5 Land Al Muroj High Income .- .- 191,563 1,500 TBD Not Launched GC6 Land Al Muroj High Income .- .- 134,397 1,400 TBD Not Launched TH3 Land Al Muroj High Income .- .- 112,448 1,450 TBD Not Launched Land Projects 3,057 449 2,906,226 1,434
Total Unreleased Units Sellable Area Sale Price Per SQM Construction Progress Status Community Type District Target Income Total Released Units
Page 34
Land Use GLA NLA A
IV IA 1,500,000 1,316,000 IV IB 2,100,000 1,816,200 IV Phase 2 22,000,000 17,855,000 IV Phase 3 7,000,000 6,101,000 IV Phase 4 6,440,000* 3,398,000 Bonded Zone 3,000,000* 2,514,000 Northern Parcel 5.400,000* 4,590,000
3% 5% 51% 16% 17% 8% IV IA IV IB IV Phase 2 IV Phase 3
IV Phase 4 Bonded Zone
%IV Break reakdow down n
Page 35
Phase IV IA Phase IV IB Phase IV 2 Phase IV 3 E&F Industrial Valley Total Area Sold (in millions) Sold Leased
69% 88%
10.7 1.2
29%
66%
*Rent is collected 1 year in advance and prorated through out the year whereas, sales revenues are recognized immediately in the month of sale.
Phase IV 3 B
60% 100%
Total Area Leased (in millions)
1.3 1.8 6.52 0.9
Page 36
*Rent is collected 1 year in advance and prorated through out the year whereas, sales revenues are recognized immediately in the month of sale.
rted re-def efining ning its business iness strategy ategy
cial zones
in IV : Bonded ded Zone, e, Gas Zone, e, and warehou ehousing ing
ader connect nectiv ivity ity through gh the operat eratio ional al King Abdullah h Port along g with the Haramai ain High Spee eed Railway lway and the planne ned Saudi di Land Brid idge ge
2015 was a s stron
g year r for IV seeing eing 17 New Tenants ants
15 of which execu ecuted ed indust stri rial al lease ase agree eement ents s total al amount of le lease sed land 324,57 577 7
2 industrial rial sale le agree eements nts for a t total al amount of sold ld land d of 485,971 71
gned ed 5 5 new lease e agreements ements and 2 s sale agreement ement for total al sqm m of 138,050 050 and 165,464 464 sqm m respect pectively ely
gned ed deals s at record d lease e and sale e rates es
rrent lease ase is SAR 16-18 / sqm
le is SAR 585 / s sqm
Page 37
Millions Sqm
Page 38
6 7 11 14
5 10 15 2012 2013 2014 2015 2016
18
Product 2012 2013 2014 2015 2016 Budget Sales Revenue 286 480 219 105 238 Product 2012 2013 2014 2015 2016 Budget Operating Revenue 15 28 33 47 59 Actual Sale Price/SQM (YoY) Product 2012 2013 2014 2015 2016 Budget Sales Price (SR/sqm) 202 247 413 490.5 585 Lease Price (SR/sqm) 6 7 11 14 14.42
200 300 585 545 445
50 100 150 200 250 300 350 400 450 500 550 600 2012 2013 2014 2015 2016
22% 48% 50% 30% 49% 19%
Actual Lease Price/SQM (YoY)
*Revenue and Sales figures are in millions
Page 39
7% 40%
Page 40
Danish Samad EEC Group Treasurer DSamad@kaec.net Tel Direct: +966 12 510 6955 Mobile: +966 54 606 3998 Firas Maad Treasury and Investor Relations FMaad@kaec.net Tel Direct: +966 12 510 6729 Mobile: +966 50 565 3225