ECONOMIC INFLUENCE IN MASSIVE ONLINE SOCIAL NETWORKS Sinan Aral NYU - - PDF document

economic influence in massive online social networks
SMART_READER_LITE
LIVE PREVIEW

ECONOMIC INFLUENCE IN MASSIVE ONLINE SOCIAL NETWORKS Sinan Aral NYU - - PDF document

ECONOMIC INFLUENCE IN MASSIVE ONLINE SOCIAL NETWORKS Sinan Aral NYU Stern School of Business and MIT, 44 West 4 th Street Room: 8-81, New York, NY 10012 sinan@stern.nyu.edu Lev Muchnik NYU Stern School of Business, 44 West 4 th Street Room: 8-80,


slide-1
SLIDE 1

ECONOMIC INFLUENCE IN MASSIVE ONLINE SOCIAL NETWORKS

Sinan Aral NYU Stern School of Business and MIT, 44 West 4th Street Room: 8-81, New York, NY 10012 sinan@stern.nyu.edu Lev Muchnik NYU Stern School of Business, 44 West 4th Street Room: 8-80, New York, NY 10012 lmuchnik@stern.nyu.edu Arun Sundararajan NYU Stern School of Business, 44 West 4th Street Room: 8-93, New York, NY 10012 arun@stern.nyu.edu Extended Abstract of Research in Progress Submitted to the 2009 University of Utah Winter Conference on Business Intelligence

slide-2
SLIDE 2

Aral, Muchnik and Sundararajan Economic Influence in Massive Online Networks

1

Introduction We use an unprecedented data set to examine the extent to which networked social relationships between consumers explain, and in fact influence, patterns of user behavior, e-commerce service adoption, online demand and ultimately revenue generation. Our data include a global instant messaging (IM) network of 27 million users from one of the largest online portals in the world, combined with a) detailed data on the day-by-day adoption of a mobile service application launched by the portal in June 2007, and b) detailed and precise data on nearly all e-commerce actions taken by the same users on the portal’s various websites. The data contain daily IM message traffic for each of the 27 million users, the adoption date and per day page views of users of the mobile service application, per-day page views of different types of portal content (for example, sports, weather, and finance) for all users, and detailed geographic and demographic data. It took two and a half years to negotiate access to the data, which we intend to make public for validation, verification and continued research. These data will allow researchers to explore many topics, but our primary goal is to analytically model influence in networked adoption processes and to econometrically distinguish influence from selection in the relationship between consumers’ social relationships and their online decisions. Simply stated, the research question is: to what extent do networked relationships influence consumers’ economic choices, creating systematic population level patterns in product demand and other user behaviors? Our findings could have dramatic implications not

  • nly for e-commerce, but also for our collective understanding of how networks influence outcomes of

social and economic significance. In their most immediate application, our findings inform research in

  • nline marketing, consumer demand, organizational economics, and the diffusion of information and

social influence in large populations. There has been a recent explosion in research about networks of various kinds. Our project and

  • thers like it are of unique interest to WCBI because they combine the analysis of massive electronic

networked data sets with questions relating to economic and business impact. Scholars across disciplines as diverse as economics, sociology, computer science and physics have examined the persistent structural properties of networks (Newman 2003) how they form, evolve and dissolve (Price 1976, Barabasi and Albert 1999), and how they affect socioeconomic outcomes like information worker productivity (Aral et

  • al. 2006, 2007, Aral and Van Alstyne 2007) and global online demand (Oestreicher-Singer and

Sundararajan 2008a, 2008b). While social network analysis is not new (Mereno 1940) it has undergone a recent paradigm shift caused by the availability of large networked data sets which have opened the door to studies of population level human behavior on scales orders of magnitude greater than what was previously possible (Lazer et al. 2008). Our current project exemplifies this shift by using a massive networked data set to ask one of the most fundamental questions in the domain of network science: to what extent do networked social relationships influence individuals’ choices. We will address this question directly using a quasi- experimental research design with control and experimental groups, which we will combine with several econometric strategies for the identification of peer influence in networks. Data We describe how the data set was constructed in detail to convey how we intend to achieve our research goals. We first sampled all users who had adopted the new mobile service between June 1, 2007 and October 31, 2007.1 This ‘seed experimental sample’ consists of 384,843 nodes that we labeled ‘service adopters.’ We then created a ‘seed control sample’ by taking a random sample of 2% of the entire IM network. This ‘seed control sample’ consists of 3,177,943 nodes that we labeled ‘random control seeds.’ We executed a two-step snowball sampling procedure which traversed network links defined by the existence of IM message traffic, two steps out from every control and experimental seed node, collecting the local network neighborhoods of all seed nodes in both the control and experimental

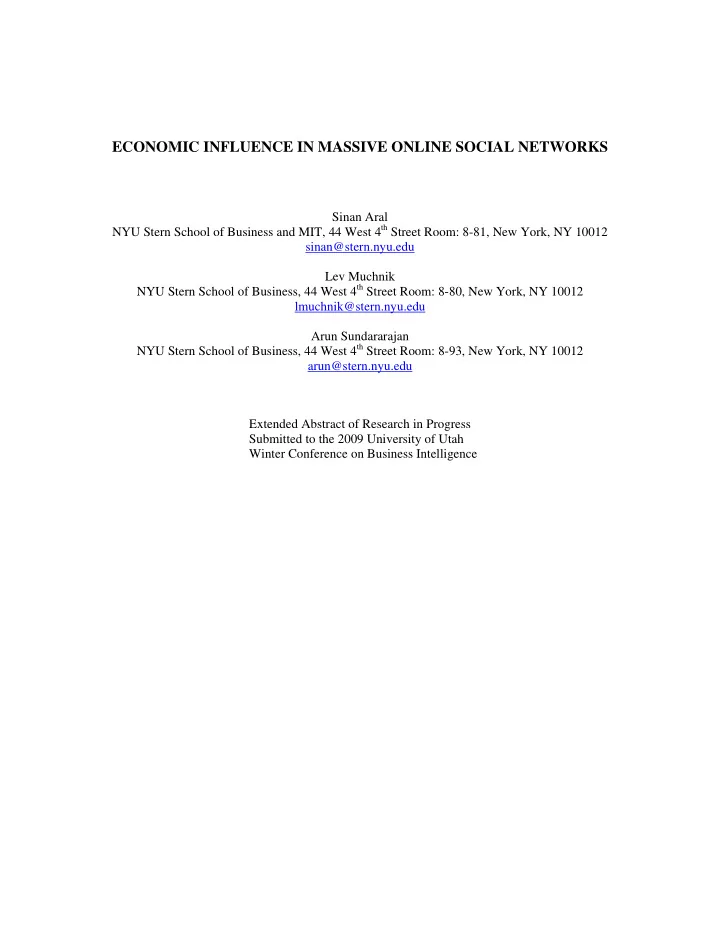
1 To focus on true adopters we restricted the sample to those users who adopted between June 1, 2007 and October 31, 2007 and

who used the service (had one page view) between September 1, 2007 and October 31, 2007.

slide-3
SLIDE 3

Aral, Muchnik and Sundararajan Economic Influence in Massive Online Networks

2

  • populations. The first step of the snowball sampling procedure yielded 9.1 million nodes that were IM

contacts of either the control or experimental seed node populations. We then collected the local network neighborhoods of all first step snowball sample nodes (‘first-step’ nodes) by sampling all users who exchanged at least one message with first-step nodes. The second step of the snowball sampling procedure yielded an additional 14.8 million users, each of whom is two steps away from a seed node. Taken together, these quasi-experimental sampling procedures collected networked data on 27.4 million users of the IM network who registered over 14 billion page views and who sent 3.9 billion messages

  • ver 89.3 million distinct relationships during a sample month.

Next, we collected detailed usage behavior data about all users. These include Geographic and Demographic Data,2 IM Usage Behavior,3 PC Usage Behavior,4 Mobile Usage Behavior (with variables analogous to PC Usage Behavior), Mobile Service Usage Behavior (with variables analogous to PC Usage Behavior), and finally Adoption Data (date of mobile service download). Figure 1 graphs the adoption curve – the number of mobile service adopters per day – from June 1, 2007 through October 31, 2007.5 Figure 2 graphs log-log plots of the degree distributions for all users (top graph), and the number

  • f adopters in the local networks of both random and adopter seed nodes at the time of their adoption

(bottom graph), both of which have tails that follow a power law distribution as is typical in a number of empirical networks.

06/01 07/01 08/01 09/01 10/01 5000 10000 Time, days Adopters per day 06/01 07/01 08/01 09/01 10/01 1 2 3 4 5 x 10

5

Time, days Adopters per day 10 10

1

10

2

10

3

10

4

10

  • 10

10

  • 5

10 k, IM neighbors P(k) 5 10 15 20 25 30 35 40 45 50 10

  • 10

10

  • 5

10 k, IM neighbors (Adopters) P(k) adopters non-adopters

Figure 1. Adoption Curve Figure 2. Degree Distribution / % Adopter Contacts

Figures 1 and 2 illustrate how adoption increases linearly over time with clear points at which beta testers first adopt, an adoption spike at launch (where we hypothesize peer influence to be weak but advertising influence to be strong), and otherwise regular adoption dynamics with peaks during media events and troughs during suspected outages affecting the download server (July 26. 2007, which recorded no new adoption). There are also noticeable differences in the networks and usage behaviors of adopters and non-adopters that are suggestive of influence. We conducted t-tests of mean differences and (as the distributions are generally fat-tailed) Kolmogorov-Smirnov tests of distributional differences of several key variables across adopters and non-adopters to investigate the potential for influence in this network (see Table 1). The data show that those who adopted the mobile service have a five-fold higher percentage of adopters in their local networks at the time of their adoption (t-stat = 100.12, p < .001; k.s.- stat = 0.06, p < .001), receive a five-fold higher percentage of messages from adopters than non adopters at the time of their adoption (t-stat = 88.30, p < .001; k.s.-stat = 0.17, p < .001), send and receive more

2 These data include primary country, secondary country, age and gender. Primary country refers to the country from which

users accessed the portal most often. Secondary country refers to the country from which users accessed the portal second most

  • ften.

3 These data include degree, # IM messages, # adopter friends, and # IM messages to/from adopters among other variables. 4 These data include total page views (PVs), front page PVs, News PVs, Finance PVs, Sports PVs, Weather PVs among other

variables.

5 The application allows users to access portal content formatted for easy mobile use and with additional mobile only features.

slide-4
SLIDE 4

Aral, Muchnik and Sundararajan Economic Influence in Massive Online Networks

3

Table 1. Select Descriptive and Test Statistics of Difference Between Adopters and Non-Adopters

Adopters Non-Adopters t-test k.s.-test Variable Obs. Mean S.D Obs. Mean S.D t-stat. p k.s.-stat p Degree 515236 5.10 28.00 2974288 3.67 28.33 33.88 0.00 0.13 0.00 # Messages 515236 418.63 1966.55 2974288 243.93 1743.84 59.82 0.00 0.13 0.00 # Adopter Friends 515236 0.13 0.84 2974288 0.02 0.21 95.75 0.00 0.06 0.00 % Adopter Friends 183390 0.05 0.15 665909 0.01 0.07 100.12 0.00 0.06 0.00 # Messages to/from Adopters 515236 14.51 203.82 2974288 2.29 86.76 42.34 0.00 0.14 0.00 % Messages to/from Adopters 183390 0.05 0.17 665909 0.01 0.08 88.30 0.00 0.17 0.00 Total Page Views 515236 757.67 1951.71 2974288 420.93 1044.65 120.88 0.00 0.15 0.00 News 515236 10.31 83.37 2974288 4.14 40.64 52.10 0.00 0.11 0.00 Finance 515236 17.46 349.95 2974288 4.82 212.60 25.14 0.00 0.10 0.00 Sports 515236 49.82 317.66 2974288 24.47 228.65 54.87 0.00 0.06 0.00 Weather 515236 0.72 7.20 2974288 0.31 5.62 38.64 0.00 0.13 0.00

total messages (#messages t-stat = 33.88, p < .001; k.s.-stat = 0.13, p < .001), and are more highly connected (degree t-stat = 33.88, p < .001; k.s.-stat = 0.13, p < .001) than non-adopters. These data may suggest the presence of influence: when compared to randomly selected nodes, adopters communicate with a higher number of prior adopters leading up to the time they adopt. Nevertheless, this does not rule out the possibility that individuals may adopt the product due to preference similarities with their friends. These alternative explanations frame the puzzle at the heart of our ongoing work: Do social choices cluster in networks due to selection (friends have similar tastes), or influence (friends induce their contacts to make similar choices by making them aware of the product or persuading them to do so).6 Initial Empirical Estimation We construct two preliminary models of service adoption. First, we estimate a logistic regression

  • f the probability of adopting the new mobile service as a function of users’ local network characteristics,

their individual characteristics, their local network neighbors’ average characteristics, and demographic variables (shown on the left). Second, we estimate how quickly after product launch each node adopts the mobile service – their adoption rate (shown on the right). As the dataset contains right censored data, OLS can produce biased and inconsistent estimates of rate analyses (Tuma and Hannan 1984). We therefore use a hazard rate model of the likelihood of a user adopting on a given day, conditional on not having adopted earlier. In each equation βjXi represents vectors of parameters and variables detailed above and reported in the next section. Preliminary Results Table 2 summarizes a subset of the coefficients estimated from these preliminary models. Space constraints preclude detailed discussion and interpretation of the coefficients. However, both sets of results are indicative of the same trend in the data. Most saliently, the coefficients in rows XI through XII show that both the number and the percentage of one’s local network who have adopted the mobile service are highly predictive of one’s propensity to adopt. The negative coefficient in row X might indicate that if one’s friends influence one to adopt, this influence diminishes when a user has more

  • friends. Additionally, while the average individual activity of one’s friends is positively associated with
  • ne’s propensity to adopt (as illustrated by the positive coefficients in row III of the table), the average

network activity of one’s friends, as measured by both how connected they are (row I) and how actively they interact with their friends (reported in row II) is negatively associated with one’s propensity to adopt.

6 Separating influence through awareness from influence through persuasion is an interesting but second order distinction.

slide-5
SLIDE 5

Aral, Muchnik and Sundararajan Economic Influence in Massive Online Networks

4

A theory (although not the only one) which supports these findings is of local network influence: active users are more influential; however, their ability to influence others is lower if their network influence is “spread too thin” across a larger number of potential recipients. Finally, one’s own individual activity is positively associated with one’s propensity to adopt (see rows V through VII). These results support theories of both selection and of influence. Heavy consumers of time-sensitive content like finance, news and sports might have a higher desire to get this information immediately, making them more likely to adopt a mobile information service. Alternatively, adoption of the mobile service and high levels of finance/sports/news viewing might be jointly indicative of a specific kind of user who is “on the go”. Current Research Trajectory Analytical Development The first part of our research-in-progress is developing an analytical model of local network effects specifically designed to ground a more structured estimation of adoption propensity and its dependence on one’s individual and network characteristics. This model will be based on a theory of

Table 2. Results of Logistic Regression and Cox Proportional Hazards Models of Adoption and Adoption Rate

Model Type Logistic

+ + = ⎟ ⎟ ⎠ ⎞ ⎜ ⎜ ⎝ ⎛ = − =

j i i j i i i

X Y P Y P ε β α ) 1 ( 1 ) 1 ( ln Hazard

i j X

be

t r t R

β

) ( ) ( =

Model 1 2 3 4 5 6 I Mean Friends’ Degree

  • 7.354e-004***
  • 7.223e-004***
  • 3.903e-004***
  • 0.001***
  • 0.001***
  • 6.457e-004***

[4.422e-005] [4.087e-005] [4.067e-005] [4.403e-005] [4.387e-005] [4.271e-005]

II Mean Friends’ Messages

  • 9.381e-006***
  • 8.468e-006***
  • 1.905e-005***
  • 1.269e-005***
  • 1.251e-005***
  • 2.679e-005***

[1.741e-006] [1.602e-006] [1.747e-006] [1.717e-006] [1.715e-006] [1.844e-006]

III Average Friends’ PV

3.021e-005*** 1.719e-005*** 9.125e-006*** 1.545e-005*** 1.462e-005*** 1.203e-005*** [2.159e-006] [2.078e-006] [2.045e-006] [7.072e-007] [7.730e-007] [1.011e-006]

IV Total PV

5.576e-005*** 5.371e-005*** 8.082e-006*** 7.861e-006*** [1.772e-006] [1.795e-006] [2.188e-007] [2.342e-007]

V Finance PV

4.812e-005*** 2.902e-005* 3.333e-005*** 3.318e-005*** [1.340e-005] [1.306e-005] [2.532e-006] [2.653e-006]

VI News PV

4.386e-004*** 3.273e-004*** 1.114e-004*** 1.014e-004*** [4.338e-005] [4.302e-005] [6.262e-006] [6.712e-006]

VII Sports PV

5.992e-005*** 4.172e-005*** 1.451e-004*** 1.256e-004*** [9.430e-006] [9.547e-006] [6.170e-006] [6.451e-006]

VII I Weather PV

0.004*** 0.004*** 0.003*** 0.003*** [6.195e-004] [6.023e-004] [1.272e-004] [1.348e-004]

IX Total Messages

8.716e-006*** 1.385e-005*** 4.294e-006*** 5.677e-006*** [7.925e-007] [9.030e-007] [2.247e-007] [2.044e-007]

X Degree

  • 0.002***
  • 0.001***

[6.731e-005] [5.397e-005]

XI # Adopter Friends

0.153*** 0.137*** [0.003] [0.001]

XII % Adopter Friends

1.268*** 1.569*** [0.022] [0.014]

Notes: Control variables included in estimation but whose parameter estimates are not reported due to space constraints: Age, Gender, Location US, Mean Friends’ Age, and Mean Friends’ Gender. * p < .05, ** p < .01, *** p < .001.

slide-6
SLIDE 6

Aral, Muchnik and Sundararajan Economic Influence in Massive Online Networks

5

diffusion of influence through complex networks created by the interconnected local networks of users. We will start with an initial adoption and usage state, and use myopic best-response dynamics to characterize the law of motion of the network (simply put, this means we will assume that users are strategic and short-run value maximizing but are not sufficiently rational to be forward looking, and we will mathematically model how the network evolves based on the system-wide dynamics induced by this kind of individual behavior). The steady-state of a sufficiently parameterized model would correspond (approximately) to a snapshot of the network we observe, and we hope to recover some of the dynamic parameters using our time series. This will facilitate estimating how future adoption and usage patterns are affected by the variation in influence across users and services. Econometrics and Identification Establishing estimates of robust causal relationships in this context is non-trivial due to complex interrelationships and endogeneity. Briefly, we are investigating the viability of at least two identification strategies which are outlined below. A first approach simply extends the standard model of peer effects (Manski, 1993). While there are a series of impossibility results relating to identification in this context, a recent set of papers have shown that identification is possible when social effects are mediated by an underlying network which causes groups to be heterogeneous across users who belong to the same group (see, for example, Bramoulle 2007, or Calvo-Armengol at el. 2006), or when there are multiple overlapping networks mediating influence and exogenous effects aggregate in different ways from endogenous effects (see Oestreicher-Singer and Sundararajan 2008a). We have sufficient variation in our networks and potential differences in the way in which individual and group effects aggregate to exploit either of these approaches, and we are currently working on extending these. Theoretical and empirical work on identification of peer effects in networks is still in its infancy. A second approach would be to model the co-evolution of networks and behavioral attributes (or

  • utcomes) using continuous time Markov models and network panel data (for example, Steglich, Snijders

and Pearson 2004), where the totality of possible combinations of network ties and actor behaviors are the state space. The idea is to model the co-evolution of behaviors and networks as a series of micro decisions in which actors choose options that maximize their random behavioral (

beh i

U

) and network (

net i

U

) utility functions.

) , , , ( ) , , , ( z j i x i s z j i x U

net h h net h net net i

> < = > <

∑β

β

; ) , , , ( ) , , , ( > < = > <

δ β δ β i z x i s i z x U

beh h h beh h beh beh i

The state space, while finite, is too large to estimate outright, and therefore simulated method of moments techniques like Markov Chain Monte Carlo (MCMC) methods are used for estimation. This approach makes it possible to estimate the influence of network parameters on an outcome of interest while taking into consideration the influence of outcomes (as well as endogenous network parameters) on the likelihood of ties. We anticipate reporting on the results emerging from applying at least one of these techniques by February 2009. References available on request