Economic Crisis Economic Crisis (In INR millions) and and A - - PDF document

economic crisis economic crisis
SMART_READER_LITE
LIVE PREVIEW

Economic Crisis Economic Crisis (In INR millions) and and A - - PDF document

2/7/2009 Actual EBIT vs. Plan Excluding Special Items Economic Crisis Economic Crisis (In INR millions) and and A Strategy A Strategy 400 350 300 250 250 A K Chaudhuri A K Chaudhuri 200 Actual Director, ADAAP Process Solutions


slide-1
SLIDE 1

2/7/2009 1

Economic Crisis Economic Crisis and and A Strategy A Strategy

A K Chaudhuri A K Chaudhuri

Director, ADAAP Process Solutions Pvt. Ltd. Director, ADAAP Process Solutions Pvt. Ltd. Visiting Faculty, Indian Statistical Institute Visiting Faculty, Indian Statistical Institute & Chairman, National Institution for Quality & Reliability, Chairman, National Institution for Quality & Reliability, Bangalore Bangalore

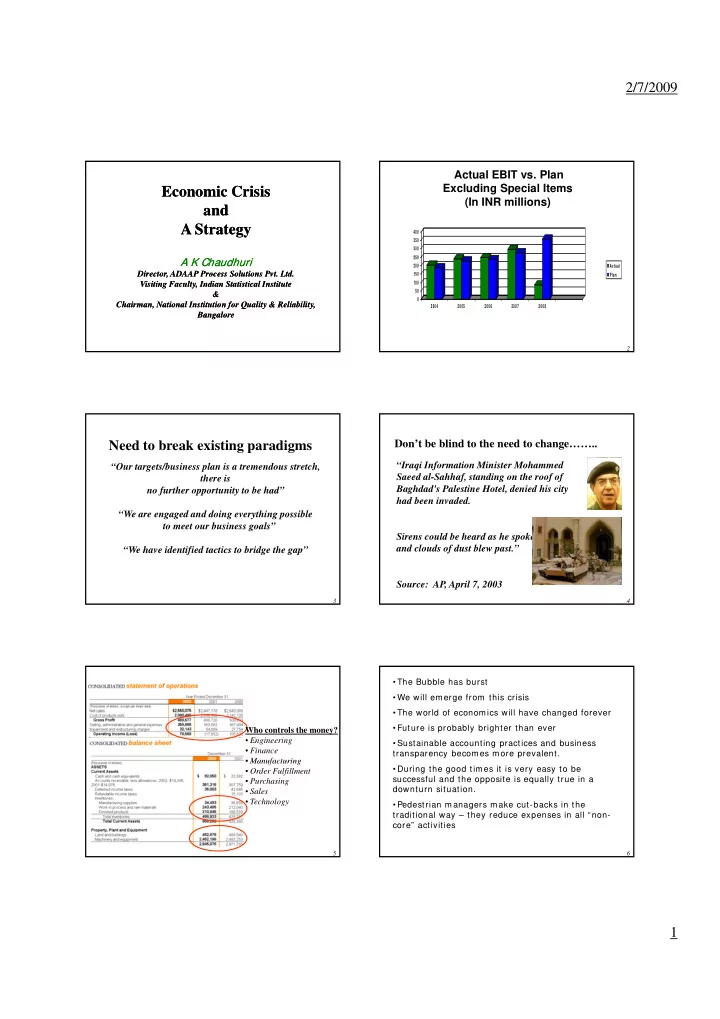
Actual EBIT vs. Plan Excluding Special Items (In INR millions)

250 300 350 400

2

50 100 150 200 250 2004 2005 2006 2007 2008 Actual Plan

“Our targets/business plan is a tremendous stretch, there is no further opportunity to be had”

Need to break existing paradigms

3

“We are engaged and doing everything possible to meet our business goals” “We have identified tactics to bridge the gap”

Don’t be blind to the need to change……..

“Iraqi Information Minister Mohammed Saeed al-Sahhaf, standing on the roof of Baghdad's Palestine Hotel, denied his city had been invaded.

4

Sirens could be heard as he spoke and clouds of dust blew past.” Source: AP, April 7, 2003

Who controls the money?

  • Engineering
  • Finance
  • Manufacturing

5

  • Manufacturing
  • Order Fulfillment
  • Purchasing
  • Sales
  • Technology
  • The Bubble has burst
  • We will emerge from this crisis
  • The world of economics will have changed forever
  • Future is probably brighter than ever
  • Sustainable accounting practices and business

transparency becomes more prevalent.

6

  • During the good times it is very easy to be

successful and the opposite is equally true in a downturn situation.

  • Pedestrian managers make cut-backs in the

traditional way – they reduce expenses in all “non- core” activities

slide-2
SLIDE 2

2/7/2009 2

Quality Management

  • In difficult times, you must be innovative – you must improve efficiency

and effectiveness.

  • Many have long predicted a bursting economic bubble; simply because

history shows that the good times never roll forever.

  • Regardless of the causes, we can safely predict that we will emerge

from this crisis.

  • The world of economics will have changed forever.
  • Business leaders will have been forced to adopt new processes and
  • strategies. We might suffer through a few difficult years.
  • But the future is probably brighter than ever as sustainable accounting

practices and business transparency becomes more prevalent.

Quality Management

  • Prudent organisations use the good times to prepare

for the bad.

  • The companies that maintained that diligent focus

are the ones best positioned to ride this wave of uncertainty. During the good times it is very easy to be successful. But the opposite is true in a downturn. pp

  • You must do a GREAT job at a GREAT price AND you

must provide GREAT service.

Quality Management

  • In difficult times, you must be innovative.

You must improve efficiency and effectiveness.

  • These times that we see great business leaders

emerge and distinguish themselves from “pedestrian managers.”

  • Core activities are considered to be customer

acquisition (sales etc ) and production acquisition (sales, etc.) and production.

  • The first areas to be downsized tend to be marketing,

quality analysis, training, etc. But this is, in my

  • pinion, the wrong approach – it creates opportunities

for competitors. It is overly simplistic.

  • Let’s not focus on cost reduction
  • Strategic plan as a positive business development

exercise as opposed to a negative cost-slashing process.

  • Cost containment will be a feature of the plan, but
  • nly in so far as it supports the business

development strategy.

10

  • A good strategy will plan for reduced competition,

increased market share and increased customer loyalty post-recession

  • The operational targets and KPIs assigned to
  • perational business units. An approach to

efficiency is very different from an approach to minimize headcount & transport costs. Enterprise cost reduction is a wider approach towards controlling the company's expenses and leading the organization towards improvement It does not only imply focusing on isolated cost reduction exercise. Enterprise cost reduction addresses a number of key cost-aspects that span th t i h th b i fi ti

11

the enterprise, such as the business configuration,

  • rganizational structure and design, business and

process complexity, external expenses and the benefits.

Definition of Insanity?

“ Doing the same thing over and

  • ver again and expecting a different

12

result.”

Ben Franklin Politician

slide-3
SLIDE 3

2/7/2009 3

The importance of a management system

Vision and Strategy Management System Fundamentals Projects Initiatives

Quality Management in Nineties and there after

Finally, engage in the above process as a dynamic, ongoing plan of service and customer experience innovation. In reality, the experts have mixed views about In reality, the experts have mixed views about how long this downturn will last – so you must be prepared to continually innovate in a recessed economy for the foreseeable future.

Quality Management in Nineties and there after

  • Strategic planning processes now involve employees at every

level and from every part of an organization. They also include customers, suppliers and even competitors. Hierarchical management structure is beginning to change dramatically with the introduction of self-directing work teams. Service Level Agreements have created completely new

  • Service Level Agreements have created completely new

working relationships for the internal service providers like laboratories, archives, IT functions etc. to expand the

  • rganization and focus on performance results and customer

satisfaction measurements.

  • Self-directing work teams. Organizations, increasingly process-

focused, are destroying the former barriers in the form of Quality specialists that limited their progress.

Translating Strategy Into Results

  • -a systematic method to

16

y measure, analyze and improve business processes to identify critical areas that can cause breakthrough results in market penetration,

  • rganizational speed and the

cost of doing business.

Haul up sail fast and right to stand on course !

Introduction

17

“Less than 10% of the formulated strategies are really implemented”

Traditional Financial Reporting: Focus only on financial indicators, not the business KPI’s Story of past events Overwhelming dataflow, limited information

18

No link with the strategy

slide-4
SLIDE 4

2/7/2009 4

W E NEED TO MAKE I T focused on the future derived from the strategy not only a controlling system , but

19

not only a controlling system , but also a m anagem ent system , incorporating all KPI ’s

WHAT IS THE PURPOSE OF A BUSINESS ORGANISATION?

  • Investors are moving towards total shareholder return on

their investment in a company.

20

  • A strategy geared towards value creation is an essential part of

forward-looking business.

  • This will enable a business to attract and retain further capital

for growing businesses.

Operational decisions affect value

Efficient Operations →Managing costs within threshold parameters →Understanding the impact of cycle times on value →Focussing the right resources on the right issues →Balancing innovation with risk and return

21

Optimal Capital Base →Managing existing and planned capital needs →Creatively taking advantage of tax rates Optimal Business Mix →Evaluating / segmenting the Value Potential of Products/ Services →Focussing on differentiating core competencies →Managing Fixed Assets Value Target

VALUE DRIVERS?

  • Volume growth
  • Margin growth

O ti ki it l

22

  • Optimum working capital
  • Reduce value destroyers
  • Lower cost of capital

……….

  • Design Corrective Action, Rew ork-Design

Change, Scrap-Design Change

  • Purchasing Failure Costs
  • Purchased Material Reject Disposition
  • Purchased Material Replacem ent Costs
  • Supplier Corrective Action,Rew ork of

Supplier Rejects ,Uncontrolled Material Losses ,Manufacturing Failure Costs M t i l R i / C ti A ti

23

  • Material Review / Corrective Action

Disposition Costs Troubleshooting/ Failure Analysis I nvestigation Support Costs Operations Corrective Action Failure to Transfer from Design to Manufacturing ,Rew ork and Repair Re-inspection/ Retest Costs, Failure to Scale Up

  • Poor Docum entation
  • Excess W I P, Excess RM I nventory, Excess FG

I nventory,Excess Tool Consum ption ,Excess Die Consum ption ,Custom er Com pliant I nvestigation

  • Returned Goods ,Retrofit Costs ,W arranty Claim s
  • Recall Costs ,Liability Costs ,Penalties
  • Other External Failure Costs ,Purchasing Appraisal

Costs ,I ncom ing I nspection and Test ,Measurem ent Equipm ent Qualification of Supplier Product Source I nspection and Control Program s

24

Manufacturing Appraisal Costs Planned I nspections, Tests, Audits Checking Labor Product or Service Quality Audits I nspection and Test Materials Set-Up I nspections and Tests ,Depreciation Allow ances Maintenance and Calibration Outside Certifications External Appraisal Costs Field Perform ance Evaluations

slide-5
SLIDE 5

2/7/2009 5

Pull / Kanban TPM 5 S System Balanced scorecard EFQM Six Sigm a Lean TOC SPC

Quality Improvement Approaches

SPC DOE Survey Plan MSA I SO 9 0 0 0 QS 9 0 0 0 Jidoka Poka-yoke TRI Z Value Engineering BPR

Project Portfolio

y1 y2 y3 y4 y5

y11 y12 y13 y21 y22 y23 y31 y32 y33 y41 y42 y43 y51 y52 y53

Y

Project Identification, Assessment, and Selection

  • Critical business issues

(VOB, VOC)

  • Resources

Project Assignment Project Charter Project Execution, Validation, and Control

  • Project

Execution

  • Monthly 6sigma

Project Reviews

Key Success Factors: Portfolio

y1 y2 y3 y4 y5

Y

  • Business-level objective
  • Driven by Customer CTQ’s
  • One business owner

Must be Measurable

Key Success Factors Business Ys

  • 1. Leadership: Urgency,

Coalition

  • 2. Metrics
  • 3. Robust Portfolio

(Ali d ith St t )

27

y1 y2 y3 y4 y5

x1 x2 x3 x1 x2 x3 x1 x2 x3 x1 x2 x3 x

1

x2 x3 Potential lean6sigma Projects

  • Focused
  • Measurable
  • Vital Few
  • Business Owner

(Aligned with Strategy)

  • 4. Full-time, Talented Staff
  • 5. Rigorous Problem

Solving Toolkit

Critical to Customer and Business

Voice of Business Critical to Process (CTP) Critical Business R ’t

  • Major business

drivers (profitability, growth, new products…..)

  • Specific

business drivers (COGS, price, product x, scrap…..)

  • Process or product

specific business requirements (flow, cycle time, error rates, cost…..)

28

Business (CTP) Reqm’ts Critical to Quality (CTQ) Voice of Customer Critical Customer Reqm’ts

  • Major Customer

needs (design, cost, quality…..)

  • Specific

customer needs (design goals, price, DPM….)

  • Product (or service)

specific customer requirements (dimensional, delivery, DPM, packaging, cost....)

Project Selection

Y y1 y11

.

1 2 ,0 7 4 I n M Euro ( 2 4 2 ) 11,875 4 3 6,867 2 ,2 5 6 8 5 2 5,008 4 1 2 5 6 7 157 3 1 ,4 4 3 3 4 5 3 0 ,8 9 7 5 6 4 5,754 2 3 1 1 2 3 4 5 ( 996) 3 4 3,639 1 2 4 5 6 3 4 5 NOPAT

  • Mfg. Cost Var.
  • Mktg. PBI T

OD Adj. Output cost I nput Cost Stores Cr. + / - in WI P

  • Misc. Output
  • Dir. Mat.
  • Dir. Lab.
  • Mat. OH

Shop OH GOH Com m . Exp

  • Alloc. Exp

Sales / Serv Cost of Sales ED on Sales PRE T&C SPE NDC PBI T Other I ncom e

One of the deterministic Financial models

2 1 8 3 9 6 2,115 2 0 3,450 4 7 12.00% 7 0 9 5 1 0 189 465 4 5 6 3 4 5 2,105 2,254 2 3 4 1,640 3 8 0 614 2 3 4 EVA Cap. Chg. Tax A&M Alloc ODE Estab Other Exp. WACC Cap. Em p. Net F. Assets Net WC Current Assets Current Liab. MMI WI P FG

  • Cust. OS

OCA Vendor Cr.

  • Cust. Adv

OCL

Balanced Score Card 2007 Organization : NXP Semiconductors Limited Thailand

Results (Month) Freq 1 2 3 Q1 4 5 6 Q2 Financial

  • 1. EBIT (M EURO), cum

M 1.5 2.0 2.2 2.2 0.9 2.4 3.4 3.4 3.a Break-even point (%) (Excl Subcon) M 53.7 67.3 67.9 61.8 84.2 61.3 63.9 67.2

  • 4. Business Renewal Cost Savings (M.EuM

0.0 0.4 0.3 0.3 0.3 0.4 0.7 0.7

  • 5. Purchasing Savings (M.Euro) Cum

M 0.1 0.1 (0.0) (0.0) 0.0 0.4 0.6 0.6 Customer

  • 1. Customer Satisfaction %

M 63.8 65.7 83.4 70.2 83.7 86.2 91.8 87.0

  • 2. RLIP(%)

M 90.3 90.7 89.6 90.2 82.9 84.7 88.6 85.2 ( )

  • 3. Stacked Leadtime, 95% tile (days)

M 6.9 7.6 7.2 7.2 9.9 7.1 7.1 7.3

  • 4a. Number of PSX Cust Complaints (#) M

20.0 17.0 9.0 46.0 16.0 9.0 9.0 34.0

  • 4b. Number of automotive Complaints (#) M

15.0 16.0 24.0 55.0 23.0 10.0 5.0 12.0

  • 5. TPT customer Complaints, 90% tile (daM

6.6 6.4 6.7 6.6 6.5 6.8 7.0 6.9 Process

  • 1. Assembly Yield (PPM)

M 1464 1386 1400 1417 1600 1300 1300 1400

  • 2. Cost of Non-Quality Improvement (M.EuM

0.429 1.060 1.563 1.560 1.777 1.892 2.238 2.238

  • 3. SPC Assy CpK > 1.67 (%)

M 95.2 95.3 95.7 95.4 95.5 96.1 96.3 96.0

  • 4. Assy Asset Operational Utilisation (%) M

85.0 87.3 87.2 86.5 86.0 87.8 89.0 87.6

  • 5. Test Asset Operational Utilization (%) M

89.7 89.3 88.9 89.3 89.6 91.5 92.0 91.0 Learning

  • 1. Number of black&green belts trained # M

0.0 0.0 0.0 0.0 0.0 15.0 16.0 16.0 2.Skill Matrix Score M 89.0 91.0 92.0 93.0 92.0 92.0 78.0 82.0

slide-6
SLIDE 6

2/7/2009 6

Process PIV PIV POV

CTQ

Manage “Correct” (In-Spec.) Defect- Free!

Define: Clearly State the Problem

in terms of “Defects” or “Variation” which Upset the Customer/Management

Define and Measure

Process PIV POV

CTQ

PIV

Measure: Describe the Performance of

the Process Quantitatively

Measured Units Counted Units

then, Identify Key Inputs Process PIV PIV PIV POV CTQ Manage “Correct” (In-Spec.) Defect- Free! PIV

Analyze

Analytically Describe the Relationship Between

Inputs and the Output . . . to Find the Inputs with the Biggest Impact on the Output

Process PIV PIV PIV POV

CTQ

Manage “Correct” (In-Spec.) Defect- Free! PIV High Low Medium High

Improve

????????

Systematically Find the Combination Which Delivers the Optimal Output

Control Control Control

Manage “Correct” (In Spec ) Defect- F !

Control

Process PIV PIV PIV POV

CTQ

(In-Spec.) Free! PIV High Low Medium High

Lock In the Inputs to Routinely Generate

the Optimal Output!

f (X) f (X) Y= Y=

The Focus of Six Sigma

To get results, should we focus our behavior on the Y or X ?

  • X1 . . . XN
  • Independent
  • Input-Process
  • Cause
  • Problem
  • Control

Y Dependent Output Effect Symptom Monitor

g ,

If we are so good at X, why do we constantly test and inspect Y ?

Focus on X rather than Y, as done historically

Leadership & Knowledge Building

Six-sigma won’t succeed without leadership and you can’t lead

36

leadership and you can t lead what you do not understand

slide-7
SLIDE 7

2/7/2009 7

Fundamentals of 6 Sigma Project Selection

  • Must be driven by leadership
  • Must be focused on opportunities that are real and

important to the business

  • Usually based on either business financial or customer

performance A h b i i d i ifi i l

37

  • Approach may be quantitative and scientific - is always

logical

  • Involves people who are familiar with and accountable for

process performance

  • Moves from broad and high-level to precise, narrow and

specific

  • Ends with a Project charter

Some examples of six sigma project charters for cost reduction: I. A) BACKRGROUND & REASONS FOR THE PROJECT. (Including Linkages) Total cost of material & parts for year 2008 is (X) Rs. this cost is very high. This affects the profit of company very much B) Critical Success Factor (CSF), Big (Y): Reduce Cost of Material& Parts/Car: Small (x’s).

  • 1. Cost of Body parts
  • 2. Cost of Engine parts

38

  • 3. Cost of Electrical System parts
  • 4. Cost of Mechanical Standard parts
  • 5. Cost of Polymer
  • 6. Cost of Suspension & component parts
  • 7. Cost of Transmission parts
  • 8. Cost of Trim parts
  • 9. Cost of Purchasing components

C) AIM OF THIS PROJECT INCLUDING ESTIMATED TARGET: To reduce the cost of material & parts by 10% II. A) BACKRGROUND & REASONS FOR THE PROJECT. (including Linkages) Total cost of production for year 2008 (10 months) is X Rs.for car passenger dept, this cost is very high. B) Critical Success Factor (CSF), Big (Y): Reduce Cost of production/Car Small (y’s).

  • 1. Reduction of rework at Press Shop, Final Acceptance, Body, Paint and Trim

Shop

  • 2. Inventory reduction of parts TPS, Press Shop, Final Acceptance, Body, Paint

39 and Trim Shop

  • 3. Reduce product in work flow in between TRIM and Final Acceptance
  • 4. Improve the life of Dies/Special tool.
  • 5. Reduce breakdown of equipments Press Shop, Final Acceptance, Body, Paint

and Trim Shop

  • 6. Reduce cost of Spare part and tools Press, Final Acceptance, Body, Paint and

Trim Shop C) AIM OF THIS PROJECT INCLUDING ESTIMATED TARGET: To reduce the cost of production by 50%

“There is nothing so useless as doing “There is nothing so useless as doing efficiently that which should not be efficiently that which should not be done at all ” done at all ”

40

done at all. done at all.

  • Peter F. Drucker

Y = f (X Y = f (X1, X , X2, X , X3, X , X4, …. , X , …. , Xn

n)

CAUSAL THI NKI NG AND CAUSAL THI NKI NG AND LEADI NG I NDI CATORS LEADI NG I NDI CATORS

41 All process inputs vary to some extent. All process have waste to some extent. Outputs are the sum of all of the variation in the inputs (machine, materials, methods,…), plus the value added and non-value added (waste) activities in the process.

Background Background

42

With traditional problem solving approaches, much effort is usually wasted on analyzing or ‘fixing’ the outputs, without addressing the inputs and sources of waste. Continuous improvement is an iterative process that focuses on minimizing variation and eliminating waste to bring products and services ever closer to customers’ changing needs.

slide-8
SLIDE 8

2/7/2009 8

WE’RE DI FFERENT

43

There is no such thing as “WE’RE DI FFERENT”.

PROCESS PRIORITIZATION PROCESS PRIORITIZATION

Processes CTQ ‘s

44

Leveraging for maximizing benefits. Leveraging for maximizing benefits.

PROJECTS

  • Don’t Convert it to another Statistical

exercise - An intellectual perversion!

  • Keep It focused to the Issue on hand.

For God’s Sake! For God’s Sake!

  • Don’t Get bogged down to prescriptive

Course content. Every day new and simpler theories are taking birth, thus have open mind!

Statistics is not everything Support!different situations by specific tools

Roll out Initiation Integeration1

2002 2003 2004 2005 2006

Integeration2

Institutionalization

# Champion 34 # GBs 80 #Projects 20 $ Not calculated

Low handing Fruit Manufacturing only

# Champion 70 # GBs 394 # BBs 34 #Projects 164 $ 3.2 billion Hoshin Kanri

Mfg.&After Sales

# Champion 70 # GBs 555 # BBs 61 # MBB 25 #Projects 329 $ 5.7 billion Hoshin Kanri Mfg.,After Sales & Engineering # Champion 70 # GBs 706 # YBs 150 # BBs 86 # MBBs 25 #Projects 523 $ Integrated with budgeting

Balanced score Card

  • Mfg. &Enablers

Customer Processes

# Champion 85 # GBs 766 #YBs 300 # BBs 86 # MBBs 25 #Projects 594

EFQM,

Suppliers & whole Group Co.

slide-9
SLIDE 9

2/7/2009 9 Over The Years

espatch audit score 120 110 100

109.150 117.445

Age r a ge pr e -dispa tch a udit scor e for a pr oduct

Pre-Dispatch Audit Scores are means to capture Customer satisfaction ratings.

Y e a r

  • Avg. Pre-d

2006 2005 2004 2003 2002 2001 90 80

80.345 81.765 83.065 90.555

Pre-dispatch audit scor e is obtained fr om Regulatory Body/ Custom er Repr esentative audit