
SLIDE 1
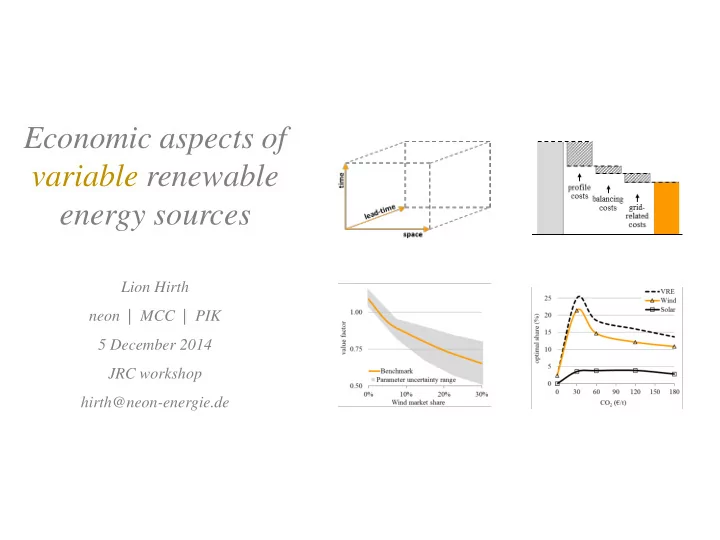
Economic aspects of variable renewable energy sources
Lion Hirth neon | MCC | PIK 5 December 2014 JRC workshop hirth@neon-energie.de
Economic aspects of variable renewable energy sources Lion Hirth - - PowerPoint PPT Presentation
Economic aspects of variable renewable energy sources Lion Hirth neon | MCC | PIK 5 December 2014 JRC workshop hirth@neon-energie.de Wind & sun deliver 15+% of electricity in some regions Global wind power capacity Share of
Lion Hirth neon | MCC | PIK 5 December 2014 JRC workshop hirth@neon-energie.de
ö
3 Lion Hirth
Global wind power capacity Global solar power capacity
Share of wind + solar in selected power systems
Data source: REN21 (2014), IEA (2014) Data source: IHS (2013)
Wind and solar power have been growing strongly. Wind and solar power combined now supply more than 15% of electricity in several power systems.
4 Lion Hirth
5 Lion Hirth
6 Lion Hirth
7 Lion Hirth
8 Lion Hirth
The electricity spot price varies between hours. The price varies between locations. The price varies between real-time and day-ahead.
Day-ahead prices in Germany for one week Day-ahead prices in Texas for one moment in time Imbalance spread in Germany in 2011/12
9 Lion Hirth
(storing electricity is costly)
(transmitting elect. is costly)
(ramping & cycling is costly)
(price differs between hours)
(price differs btw locations)
(btw contract & delivery)
10 Lion Hirth
space time
node 1 node 2 … node N hour 1 hour 2 hour T … At a given time, location, and lead-time, electricity is a perfectly homogenous good “One year“ “One power system“
Source: updated from Hirth et al. (2014): Economics of electricity
11 Lion Hirth
Any economic assessment (cost-benefit, profitability) of electricity generation technologies needs to account for differences in value of output (€/MWh). Long-term marginal value: the marginal value of output of a technology ($/MWh), accounting for timing, location, and uncertainty of generation:
𝑤𝑗
′ = 𝑢=1 𝑈 𝑜=1 𝑂 𝜐=1 Τ
𝑗,𝑢,𝑜,𝜐 ∙ 𝑞𝑢,𝑜,𝜐
Source: updated from Hirth et al. (2014): Economics of electricity
12 Lion Hirth
13 Lion Hirth
Source: updated from Hirth et al. (2014): Economics of electricity
Base-load and high-penetration VRE are the technologies with relatively low-value
14 Lion Hirth
Average electricity price Inte- gration Costs Wind market value Value gap Wind LCOE Inte- gration Costs Wind System LCOE Wind System LCOE Coal System LCOE
Net minus
15 Lion Hirth
16 Lion Hirth
17 Lion Hirth
Milligan et al. 2011, Borenstein 2012, Sims et al. 2011, ...
(price differs between hours)
(prices differs w.r.t. to lead-time btw contract & delivery)
(price differs btw locations)
(“shaping costs“) (“imbalance costs“) (“locational / infrastructure costs“)
18 Lion Hirth
Effect of timing Effect of forecast errors Effect of location
Source: updated from Hirth et al. (2015): Integration costs revisited
Integration costs
19 Lion Hirth
At high VRE shares, the other (residual) power plants are utilized less. Lower utilization implies higher specific (€/MWh) capital costs. The utilization effect is the largest economic impact of VRE.
Source: updated from Hirth et al. (2015): Integration costs revisited Source: updated from Hirth et al. (2015): Integration costs revisited
20 Lion Hirth
Profile costs reach ~20 €/MWh at 30 – 40% penetration rate. They grow at 0.5 €/MWh per percentage-point.
Balancing costs reach ~4 €/MWh at 30 – 40% penetration rate, growing at 0.04 €/MWh per percentage-point – a tenth of profile costs.
Source: updated from Hirth et al. (2015): Integration costs revisited Source: updated from Hirth et al. (2015): Integration costs revisited
21 Lion Hirth
22 Lion Hirth
23 Lion Hirth
Wind in Germany Base price
(€/MWh)
Wind Revenue
(€/MWh)
Value Factor
(1)
2001 24 25* 1.02 ... ... ... ... 2013 38 32 .85 Simple average Wind- weighted average Ratio of these two
24 Lion Hirth
Value Factor = Market value / base price
Source: updated from Hirth (2013): Market value. Based on German day-ahead spot-price data 2001 – 2013
The relative value of electricity from wind and solar power is reduced as their market share grows.
25 Lion Hirth
(net load)
20 GW Wind
30 €/MWh
CHP Nuclear Lignite Hardcoal Combined cycle (natural gas) Open cycle
Source: updated from Hirth (2013): Market value
Size of the drop: i) amount of wind generation, ii) shape of the merit-order curve, iii) ...
26 Lion Hirth
Objective: minimize total system costs
Decision variables
Constraints
Resolution
Input data
Economic assumptions
Equilibrium
(“one year”)
Implementation
Creative Commons BY-SA license
Numerical partial-equilibrium model of the European interconnected power market
27 Lion Hirth
The value factor of wind power decreases from 1.3 to 0.6 at 15% market share: three times as fast.
Source: updated from Hirth (2013): Market value Source: updated from Hirth (2013): Market value
The value factor of wind power decreases from 1.1 to 0.65 at 30% market share.
28 Lion Hirth
Solar generation is concentrated in fewer hours than wind power. The fundamental reason is earth’s rotation – at night, the sun never shines.
Source: updated from Hirth (2013): Market value Source: updated from Hirth (2013): Market value of solar
Solar power‘s market value is higher than wind powers‘s at low penetration, but drops quicker.
29 Lion Hirth
Source: updated from Hirth (2013): Market value. Parameters considered: CO2 price between 0 – 100 €/t, Flexible ancillary services provision, Zero / double interconnector capacity, Flexible CHP plants, Zero / double storage capacity, Double fuel price, ...
Prices, parameter, policies affect the market value: not a simple number.
30 Lion Hirth
Source: updated from Hirth (2013): Market value
Country Journal
Implicit value factor estimates
31 Lion Hirth
32 Lion Hirth
33 Lion Hirth
34 Lion Hirth
35 Lion Hirth
LCOE today LCOE -30%
36 Lion Hirth
37 Lion Hirth
38 Lion Hirth
39 Lion Hirth
Contour plot: the lines represent a 40% wind share. Above / left there is a higher share.
100 €/t CO2
40 Lion Hirth
41 Lion Hirth
42 Lion Hirth
43 Lion Hirth
44 Lion Hirth
45 Lion Hirth
Economics of Electricity Hirth, Lion, Falko Ueckerdt & Ottmar Edenhofer (2014): “Why Wind is not Coal: On the Economics of Electricity”, FEEM Working Paper 2014.039. www.feem.it/getpage.aspx?id=6308 Integration Costs Hirth, Lion, Falko Ueckerdt & Ottmar Edenhofer (2015): “Integration Costs Revisited – An economic framework of wind and solar variability”, Renewable Energy 74, 925–939.
http://dx.doi.org/10.1016/j.renene.2014.08.065
Market Value Hirth, Lion (2013): “The Market Value of Variable Renewables”, Energy Economics 38, 218-
Optimal Share Hirth, Lion (2015): “The Optimal Share of Variable Renewables”, The Energy Journal 36(1), 127-162. http://dx.doi.org/10.5547/01956574.36.1.5 System LCOE Ueckerdt, Falko, Lion Hirth, Gunnar Luderer & Ottmar Edenhofer (2013): “System LCOE: What are the costs of variable renewables?”, Energy 63, 61-75. http://dx.doi.org/10.1016/j.energy.2013.10.072 Market Value of Solar Hirth, Lion (2015): “The market value of solar photovoltaics: Is solar power cost-competitive?”, IET Renewable Power Generation (forthcoming). http://dx.doi.org/10.1049/iet-rpg.2014.0101 Balancing Power Hirth, Lion & Inka Ziegenhagen (2013): ”Balancing power and variable renewables“, USAEE Working Paper 13-154. http://papers.ssrn.com/sol3/papers.cfm?abstract_id=2371752