
SLIDE 1
Economic Analysis Delaware Bayshore Communities: Delaware Bay Beach - - PowerPoint PPT Presentation
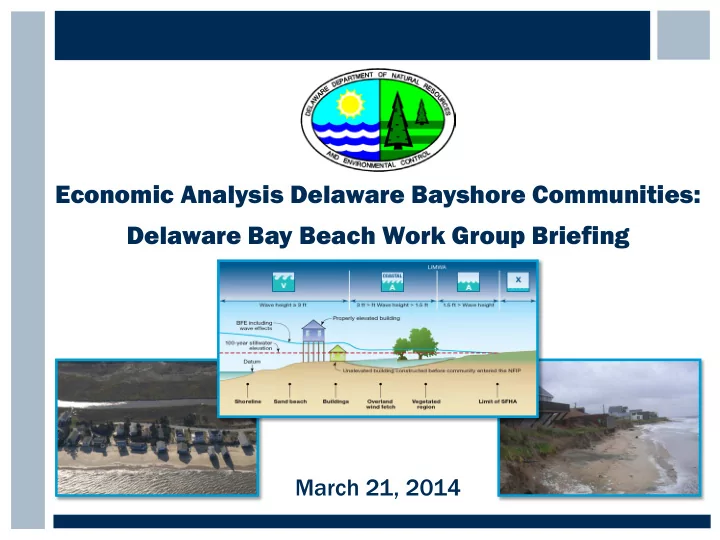
Economic Analysis Delaware Bayshore Communities: Delaware Bay Beach Work Group Briefing March 21, 2014 Summary History of Presentations Multiple Presentations to Date Since January 2011 TOPICS Geographic Coverage Management
TOPICS
– Structure Inventory - Elevations – Structure Metrics – Modeling Flood/Erosion/SLR – Flood/Erosion Damages – Recreational Beach Widths
– Flood/Erosion Damages Avoided – Recreation – Tax Revenues – Ecosystem Services
Credits: Sources for Tables, Images, Data in Presentation
BENEF EFIT IT, C COST O OR TRAN TRANSFER HO HOW ME MEASU SURED DESCRIP IPTIO ION A AND E ECONOMIC IC I INTER ERPRET ETATIO ION Sand, F Fill ill and De Demolit litio ion C Costs
Change in costs paid by the
predicted market costs. These reflect the opportunity cost of resources used for management.
Housi sing S Ser ervi vice Benefi fits
Change in the net present value of services received from homes, as reflected in property values. These reflect gains or losses to homeowners related to the continued existence of a housing structure into the future. According to economic theory, equilibrium property values should reflect the capitalized present value of future housing services.
Recreatio ional l Benefi fits
Change in the net present value of beach recreation, quantified using changes in discounted consumer surplus. Beach recreation generates non-market use values. These values can be quantified using consumer surplus, defined as the difference between what an individual would be willing to pay for beach recreation and what is actually paid in travel and access costs.
Flood
and d Eros
Dama mages
Change in net damages to homes (repair and replacement costs). Changes in beach management can influence the likelihood and severity of flood and erosion damage to homes. This is in addition to homes that are entirely lost. The true relationship between damage costs and the willingness to pay to avoid flood damage (a true measure of benefit) is generally undefined, although these are sometimes interpreted as an approximation of benefit losses.
Housin ing A Acquis isit itio ion Payments ( (Tran ansfer)
Payments from the State to homeowners to compensate for lost housing services. These reflect a transfer payment from the State to homeowners. That is, for each $1 paid by the State, $1 is received by homeowners; these payments are a simple transfer
Benefit or
Categ egory Me Measure Descr scription Benef eficiaries es ( (for quantif ifie ied b benefit its) CO COSTS TS OF M MAN ANAG AGEMENT T (RELAT ATIVE TO TO N NO ACTI ACTION) Shorel eline m e managem emen ent
Sand or fill costs
placement of beach fill material N/A Demolition
erosion N/A
QUAN ANTI TIFIED B BENEFITS O OF MAN ANAG AGEMENT ( T (RELATI TIVE TO TO NO ACTI ACTION) Eros
mig igratio ion
Recreational activity
Housing services
capitalized service value of property suffering 100% loss Property owners
Coa
flood
Avoided property and content damage
value (avoided damages do not typically provide an exact measure of economic benefit; see Chapters 3 and 5). Property owners
UN UNQUA UANTIFIED BE BENEFITS, S, COST OSTS S OR OR IMPACTS Eros
eline e mig igratio ion
Economic activity in service sectors
hotels, retail) measured in jobs and business revenue
recreational activity
Habitat protection and other ecosystem services
natural resource capital valuation
management to a small degree
ecosystem service values are likely to be minor Passive use values for the public
Tax r reve venue
Lost tax revenue for Kent and Sussex Counties
for services
N/A
Versus
Scenario
(A) (A) Sand, F Fill ill an and De Demolit litio ion (PV, $ $mill) ill) (B (B) Ho Housing Acquis isit itio ion Paym yments ts (pa paid b d by State te) (PV, $ $mill) ill) (C (C) Ho Housing Acquis isit itio ion Paym yments ts (rec ecei eived ed b by pr prope
ers) (PV, $ $mill) ill) (D) D) Recrea eation (PV, $ $mill) ill) (E (E) Ho Housing Ser ervi vices2 (PV, $ $mill) ill) (F (F) Redu duction in in Addit itio ional l Flood
and d Erosion Dama mages3 (PV, $ $mill) ill) (G (G) Net et B Benef efits (PV, $ $mill; ill; sum of
A thr through F F)
Beach ach No Nourishment (Sce (Scenario 1) 1)
61.1 $0 $0 $0 $1 $16. 6.1 $1 $18. 8.2 $2. $2.7
$24. 4.1 Basic c Ret etrea eat (Sce (Scenario 3) 3)
$61.3 $10.8
$3.0
1 Costs (or reduced benefits) enter as negative numbers. Benefits (or reduced costs) enter as positive numbers. All benefits and costs are relative to the No Action alternative.
2 Change in benefits due to the total loss of housing structures. 3 Damages to remaining housing structures. Although the beach width is similar under nourishment and enhanced retreat, damages avoided differ
due to (a) the construction of additional protective dunes under beach nourishment and the removal of homes under enhanced retreat that would
Communi nity Bea each N Nourishmen ent Basi Basic R Retreat
Net Benefit (PV, $mill) Net Benefit (PV, $mill)
Picke kering
Kitts H Hummo mmock
Bo Bowers
Sout uth Bo Bowers
Sl Slau aughter
$0.7
Prime H Hook
Broadkill ill $6.8
To Total
$24. 4.1
Notes: Net b benefit its c calc lcula lated r rela lativ ive t to t the N No A Actio ion S Scenario rio. The t table le r reports a all f figures i in 2011 d dolla llars rs. The r reporte ted d values a are t the p present v value o
stream o
estimates a aggregated a across 3 30 years (f (from 2 2011 to 2 2041) a and disc scounted a at 4 4%.
Metric Uni Units ts Bea each N Nourishmen ent Basi Basic R Retreat
Taxpayers & Non-Residents Residents
Taxpayers & Non- Residents Residents
Net B Ben enef efits PV, $ $mill
$24.0
$22.5
Note tes: All values r es rep eported i in 2011 d dollars. s. The f figures a s are t e the e prese esent v value o e of t the e st strea eam o
cost sts a s and ben enefits a s aggregated acr cross 30 30 y years ( (fr from 20 2011 t to 20 2041) a and disco counted a at 4% 4%.
Commu munity Be Beach Nour urishment
(PV, $ $mill)
Basic R Ret etrea eat
(PV, $ $mill)
Enhanced ed Ret etrea eat
(PV, $ $mill)
Taxpa xpayers & N & Non
Re Residents Re Residents
Taxpayers & Non-Residents Residents Taxpayers & Non-Residents Residents
Picke kering
$5.8 $2. $2.6
$2.8
$3.2
Kitts H Hummo mmock
7.3 $2. $2.7
$2.9
$4.2
Bo Bowers
$4.1 $1.0 .0
$0.7
$1.4
Sout uth Bo Bowers
$4.2 $0. $0.5
$0.4
$0.8
Sl Slau aughter
2.9 $1.2 .2
$0.2 $0.5
$0.9
Prime H Hook
$6.7 $2. $2.1
$1.3
$2.6
Broadkill ill
7.1 $1 $13. 3.9
$13.9
$16.6
To Total
$48.1 $2 $24. 4.0
$22.5
$29.7 Notes: s: All values r es rep eported i in 2011 d dollars. s. The f figures a s are t e the e prese esent v value o e of t the e st strea eam o
cost sts a s and ben enefits a s aggregated d acr cross 30 30 y years ( (fr from 20 2011 t to 20 2041) a and disco counted a at 4% 4%.
Community ty
Net Cost
Relative t to No No Ac Action Demolit litio ion Cost
Avoi
(fr from T Table 4. 4.2a 2a) No Nourishment Cost
St Struct ctures Cost
per str truc ucture
(PV $ $mill) ll) (PV $ $mill) ll) (PV $ $mill) ll) (No.) .) ($/str tructu ture)
Picker ering $6.25
$6.4 43
$148,800 Kitts itts H Hummock $7.68
$7.8 114
$68,400 Bowers $4. $4.87
$4.9 325
$15,100 So South B Bowers rs $4. $4.57
$4.6 69
$66,700 Slaughter $14.60
$14.6 308
$47,400 Pri rime me H Hook $7.26
$7.3 185
$39,500 Broadkill $15.77
$16 599
$26,700 To Total $61.10
$61.7 1,643
$37,500
Avoided Damages Flood 22% Avoided Damages Erosion 62% Resident 29% Nonresident 71% Recreation 16%
Pic ickerin ing B g Benefit its
Avoided Damages Flood 56% Avoided Damages Erosion 32% Resident 70% Nonresident 30% Recreation 12%
Ki Kitts Hu s Hummock Be Benefits
Avoided Damages Flood 92% Avoided Damages Erosion 2% Resident 34% Nonresident 66% Recreation 6%
Bowers B s Benefits s
Avoided Damages Flood 82% Avoided Damages Erosion 7% Resident 25% Nonresident 75% Recreation 11%
South B h Bow
ts
Avoided Damages Flood 91% Avoided Damages Erosion 0% Resident 29% Nonresident 71% Recreation 9%
Sla laugh ghter B Benefit its
Avoided Damages Flood 68% Avoided Damages Erosion 17% Resident 45% Nonresident 55% Recreation 15%
Prim ime H Hook Benefit its
Avoided Damages Flood 45% Avoided Damages Erosion 29% Resident 11% Nonresident 89% Recreation 26%
Broadkill B ill Benefit its