
SLIDE 1
EAB Hangover Evaluating impacts of emerald ash borer on forest - - PowerPoint PPT Presentation
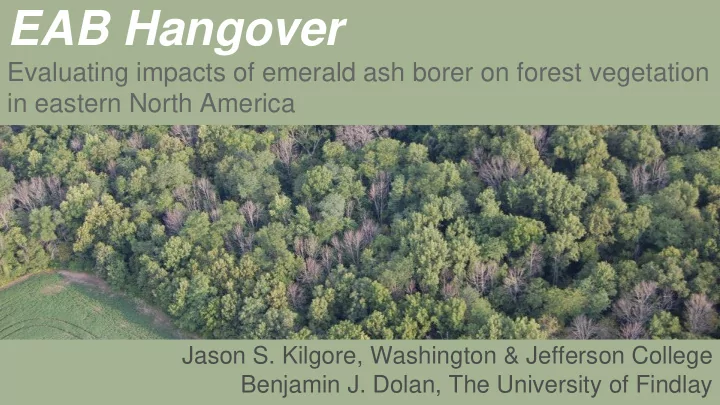
EAB Hangover Evaluating impacts of emerald ash borer on forest vegetation in eastern North America Jason S. Kilgore, Washington & Jefferson College Benjamin J. Dolan, The University of Findlay emerald ash borer ( Agrilus planipennis )
Geographical range of blue ash (F. quadrangulata)
Water stress affects rate of ash decline (continentally) Increased light availability leads to increased seedling density and sapling growth rate Increased light availability in high ash plots leads to shift toward shade-intolerant tree species and more invasive plants Certain invasive plants have a disproportionate effect on post- invasion diversity, growth rate of native trees, and time to canopy closure.
20 m 20 m
http://labs.russell.wisc.edu/eab/files/2011/06/D-shaped-exit-holes.jpeg http://vil.carpentersville.il.us/images/EAB/Canopy%20Dieback%20of%20an%20 Ash%20Tree.jpg