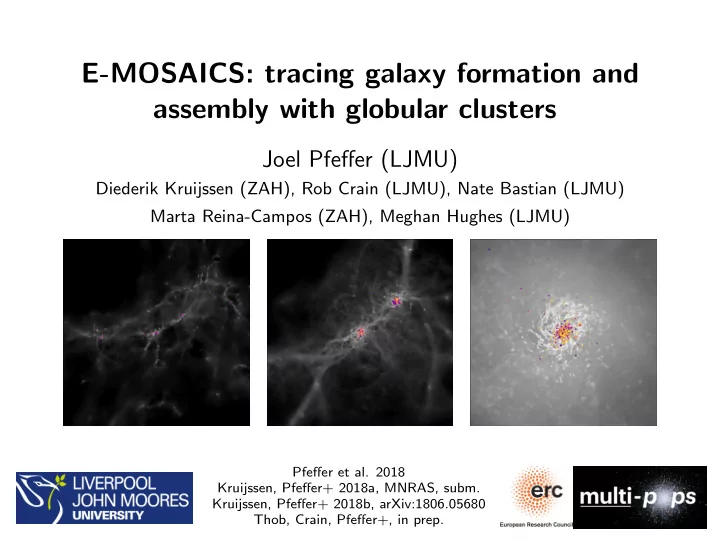
SLIDE 1 E-MOSAICS: tracing galaxy formation and assembly with globular clusters
Joel Pfeffer (LJMU)
Diederik Kruijssen (ZAH), Rob Crain (LJMU), Nate Bastian (LJMU) Marta Reina-Campos (ZAH), Meghan Hughes (LJMU)
Pfeffer et al. 2018 Kruijssen, Pfeffer+ 2018a, MNRAS, subm. Kruijssen, Pfeffer+ 2018b, arXiv:1806.05680 Thob, Crain, Pfeffer+, in prep.
SLIDE 2
Using globular clusters (GCs) to trace galaxy formation?
Globular clusters are powerful probes of galaxy formation (e.g. review by
Brodie & Strader 06)
Can observe GCs to significantly larger distances than individual stars, and (potentially) obtain metallicities, ages, kinematics
SLIDE 3
Using globular clusters (GCs) to trace galaxy formation?
Globular clusters are powerful probes of galaxy formation (e.g. review by
Brodie & Strader 06)
Can observe GCs to significantly larger distances than individual stars, and (potentially) obtain metallicities, ages, kinematics But we require a complete model for galaxy and GC formation. . .
SLIDE 4
Towards a complete model of GC formation
We want to model full star cluster populations in populations of galaxies Currently not possible to simultaneously model the small scales of star/star cluster formation (< pc) and large scales of galaxy formation (∼Mpc) in hydrodynamical simulations
SLIDE 5 Towards a complete model of GC formation
We want to model full star cluster populations in populations of galaxies Currently not possible to simultaneously model the small scales of star/star cluster formation (< pc) and large scales of galaxy formation (∼Mpc) in hydrodynamical simulations Requires:
- A model for cluster formation (observations of young star clusters)
- Cluster evolution and disruption (N-body simulations)
- Galaxy formation including baryons
SLIDE 6 Towards a complete model of GC formation
We want to model full star cluster populations in populations of galaxies Currently not possible to simultaneously model the small scales of star/star cluster formation (< pc) and large scales of galaxy formation (∼Mpc) in hydrodynamical simulations Requires:
- A model for cluster formation (observations of young star clusters)
- Cluster evolution and disruption (N-body simulations)
- Galaxy formation including baryons
Enter E-MOSAICS. . .
SLIDE 7 The E-MOSAICS project: co-formation of galaxies and GCs
MOdelling Star cluster population Assembly In Cosmological Simulations in the context of EAGLE (Pfeffer+ 18; Kruijssen+ 18) Couple sub-grid cluster model (MOSAICS) to EAGLE galaxy formation model
(Schaye+ 15; Crain+ 15)
Using EAGLE Recal (high-res) model (baryonic particle masses ∼ 2 × 10⁵ M⊙) 25 cosmological zoom-ins of Milky Way-mass galaxies (over 200 simulations in total including subgrid model testing) Near future: galaxy groups zooms (Mvir ∼ 1013 M⊙) and 34 Mpc periodic volume currently
With thanks to the Virgo Consortium for DiRAC supercomputing time
SLIDE 8 MOSAICS: sub-grid model for cluster formation and evolution
Kruijssen+ 11; Pfeffer+ 18:
- On-the-fly modelling
- Each star particle hosts its own sub-grid cluster population
⇒ Form cluster population with local bound cluster formation efficiency (CFE) at each new star particle during simulation
- Schechter initial cluster mass function (power law slope −2, with
truncation Mc,∗), consistent with observations of YSCs
- Cluster formation depends on local (gas/dynamical) properties in
- simulation. Completely described by CFE and Mc,∗
- Cluster mass-loss by stellar evolution, tidal shocks and evaporation
using the evolving local tidal field of each ‘cluster particle’
- Dynamical friction in post-processing
SLIDE 9
The E-MOSAICS project: co-formation of galaxies and GCs
First self-consistent simulations of the formation and evolution of Milky Way-type galaxies and their GC populations over full cosmic history
(Pfeffer+ 18; Kruijssen+ 18)
SLIDE 10
Two main goals of E-MOSAICS
Are GCs just evolved versions of young clusters? Yes Can we use GCs to trace the formation and assembly of galaxies?
SLIDE 11
Two main goals of E-MOSAICS
Are GCs just evolved versions of young clusters? Yes Can we use GCs to trace the formation and assembly of galaxies?
SLIDE 12
Two main goals of E-MOSAICS
Are GCs just evolved versions of young clusters? Yes Can we use GCs to trace the formation and assembly of galaxies?
SLIDE 13 E-MOSAICS: GCs are good tracers of galaxy formation
Young star clusters are the peaks of star formation in the hierarchical ISM (see
Longmore+ 14 for a review)
If GCs form like young clusters, then GCs trace the enrichment history of their host galaxy
−2.5 −2.0 −1.5 −1.0 −0.5 0.0 0.5 Metallicity [Fe/H] MW09 0.0 0.1 0.2 0.4 0.6 1.0 2.0 3.0 6.0 Formation redshift MW14 0.0 0.1 0.2 0.4 0.6 1.0 2.0 3.0 6.0 Formation redshift −2.5 −2.0 −1.5 −1.0 −0.5 0.0 0.5 Metallicity [Fe/H] MW15 MW18 2 4 6 8 10 12 14 Age [Gyr] −2.5 −2.0 −1.5 −1.0 −0.5 0.0 0.5 Metallicity [Fe/H] MW19 2 4 6 8 10 12 14 Age [Gyr] MW23 106 107 108 109 1010 Galaxy stellar mass M∗ [M⊙]
(Kruijssen, Pfeffer+ 2018, subm.)
SLIDE 14
E-MOSAICS: galaxy formation from GC age-metallicity relations
Correlate 12 GC age-Z metrics and NGC with 30 quantities describing galaxy formation E.g. Mvir, Vmax, cNFW, formation and assembly timescales, merger histories ⇒ Obtain 20 highly significant correlations (peff = p/Ncorr, Holm 79)
(Kruijssen, Pfeffer+ 2018, subm.)
SLIDE 15
E-MOSAICS: galaxy formation from GC age-metallicity relations
Correlate 12 GC age-Z metrics and NGC with 30 quantities describing galaxy formation E.g. Mvir, Vmax, cNFW, formation and assembly timescales, merger histories ⇒ Obtain 20 highly significant correlations (peff = p/Ncorr, Holm 79)
(Kruijssen, Pfeffer+ 2018, subm.)
SLIDE 16
E-MOSAICS: application to the Milky Way
(Kruijssen, Pfeffer+ 2018, MNRAS, arXiv:1806.05680)
SLIDE 17
E-MOSAICS: application to the Milky Way
MW had ∼15 mergers with galaxies M∗ > 5 × 10⁶ M⊙ The MW assembled early for its halo mass: za ≈ 1.2 (sim. mean ≈ 0.8)
(See also Mackereth+ 18, based on stellar [α/Fe]-[Fe/H] bimodality) (Kruijssen, Pfeffer+ 2018, MNRAS, arXiv:1806.05680)
SLIDE 18 E-MOSAICS: age-metallicity-mass relation for galaxies
Can we see galaxy accretion events in the GC age-metallicity relations?
(e.g. Forbes & Bridges 10; Leaman+ 13)
Galaxy enrichment history depends on galaxy mass ⇒ higher mass galaxies enrich faster (Median galaxy enrichment histories from EAGLE Recal)
2 4 6 8 10 12 14 Age [Gyr] 2.5 2.0 1.5 1.0 0.5 0.0 0.5 [Fe/H] 7.5 < log10(M * /M ) < 8 8 < log10(M * /M ) < 8.5 8.5 < log10(M * /M ) < 9 9 < log10(M * /M ) < 9.5 9.5 < log10(M * /M ) < 10 10 < log10(M * /M ) < 10.5
SLIDE 19
E-MOSAICS: MW GC age-metallicity relations
GC relations in age-metallicity space constrain both the galaxy mass evolution and the number of GCs per halo (at z = 0) MW accreted two galaxies M∗ ≈ 109M⊙ with ∼20 GCs and one galaxy M∗ ≈ 108M⊙ with ∼8 GCs (Probably more we can’t distinguish)
(Kruijssen, Pfeffer+ 2018, MNRAS, arXiv:1806.05680)
SLIDE 20
E-MOSAICS: MW GC age-metallicity relations
GC relations in age-metallicity space constrain both the galaxy mass evolution and the number of GCs per halo (at z = 0) MW accreted two galaxies M∗ ≈ 109M⊙ with ∼20 GCs and one galaxy M∗ ≈ 108M⊙ with ∼8 GCs (Probably more we can’t distinguish)
(Kruijssen, Pfeffer+ 2018, MNRAS, arXiv:1806.05680)
SLIDE 21 Formation and assembly of the Milky Way from its GCs
106 107 108 109 1010 1011 Stellar mass [M⊙]
Main progenitor Satellites 1 & 2 Satellite 3 Papovich et al. (2015) Milky Way progenitors
2 4 6 8 10 12 14 Age [Gyr]
0.0 0.5 Metallicity of newly-formed stars [Fe/H]
GCs with 105 < M/M⊙ < 106.3 Haywood et al. (2013) Galactic disc stars Snaith et al. (2015) Galactic enrichment history
0.0 0.1 0.2 0.4 0.6 1.0 2.0 3.0 6.0 Redshift
(Kruijssen, Pfeffer+ 2018, MNRAS, arXiv:1806.05680)
SLIDE 22
Formation and assembly of the Milky Way from its GCs
(Kruijssen, Pfeffer+ 2018, MNRAS, arXiv:1806.05680)
SLIDE 23
Formation and assembly of the Milky Way from its GCs
Canis Major = The Sausage/Gaia-Enceladus (?) Most massive galaxy ever accreted = Kraken
(Kruijssen, Pfeffer+ 2018, MNRAS, arXiv:1806.05680)
SLIDE 24 E-MOSAICS: using GCs to trace shapes of MW-mass DM haloes
Thob, Crain, Pfeffer+ in prep.
(Using the iterative reduced inertia tensor method, Schneider+12)
Accreted GCs trace the DM halo shape poorly. . .
0.0 0.2 0.4 0.6 0.8 1.0 ǫDM 0.0 0.2 0.4 0.6 0.8 1.0 ǫGCs
11 23 12 20 1 14 10 13 19 17 16 21 15 5 8 7 4 18 22 6 3 24 9 2
ExSitu vs DM in 90%GCs 0.4 0.5 0.6 0.7 0.8 0.9 1 Mcentral/MFOF 0.0 0.2 0.4 0.6 0.8 1.0 ǫDM 0.0 0.2 0.4 0.6 0.8 1.0 ǫGCs
11 23 12 20 1 14 10 13 19 17 16 21 15 5 8 7 4 18 22 6 3 24 9 2
Poor Fe/H vs DM in 90%GCs 0.4 0.5 0.6 0.7 0.8 0.9 1 Mcentral/MFOF
Metal-poor GCs ([Fe/H] < −1) trace the shape of the DM halo very well!
SLIDE 25 Concluding remarks/questions
With E-MOSAICS we can now trace the formation and assembly of galaxies using their GC populations Can we distinguish Satellite 1 & 2 using the orbits of their GCs? Has Satellite 2 been found? Deposited its GCs at 10-20 kpc (Myeong+18;
Helmi+18)
Many “satellite branch” GCs at <10
106 107 108 109 1010 1011 Stellar mass [M⊙]
Main progenitor Satellites 1 & 2 Satellite 3 Papovich et al. (2015) Milky Way progenitors
2 4 6 8 10 12 14 Age [Gyr]
0.0 0.5 Metallicity of newly-formed stars [Fe/H]
GCs with 105 < M/M⊙ < 106.3 Haywood et al. (2013) Galactic disc stars Snaith et al. (2015) Galactic enrichment history
0.0 0.1 0.2 0.4 0.6 1.0 2.0 3.0 6.0 Redshift