
SLIDE 1
Dynamics of Lunar mantle evolution: exploring the role of - - PowerPoint PPT Presentation
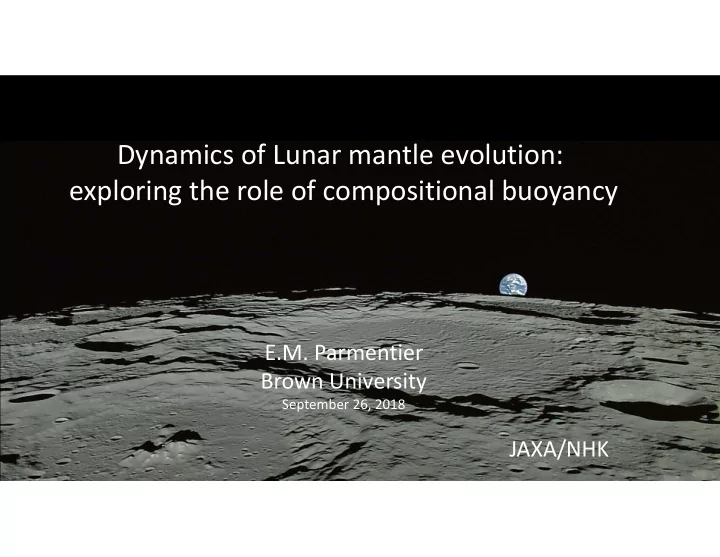
Dynamics of Lunar mantle evolution: exploring the role of compositional buoyancy E.M. Parmentier Brown University September 26, 2018 JAXA/NHK Global scale characteristics of the Moon 1) hemispheric crustal asymmetry a) mare basalt
http://curator.jsc.nasa.gov/education/LPETSS/marebasalt.cfm#fig10
Low‐Ti High‐Ti
Grove and Krawczynski (2009), Elements, 5, 29–34. Khan and Mosegaard (2001) GRL 28 1791‐1794. Warren, (2004) Treatise of Geochemistry.
Lognonné et al. (2003) Earth Planet. Sci. Lett. 211, 27‐44. Wieczorek (2009) Elements, 5, 35–40. Weber et al. (2011) Science 331:309‐312 velocity and density models Apollo seismic network
Williams, et al. JGR 2014
Stratigraphy predicted from ideal fractional solidification
Ringwood and Kesson (1976) Herbert PLPSC (1980) Spera (1992) Hess and Parmentier (1995)
Q=100 kJ/mol Q=200 kJ/mol
viscosity ∝ exp 𝑅 𝑆𝑈
Creep activation energy composition temperature Chemical structure just after overturn
Zhang et al JGR 2013
Solomon GRL (1978)
Andrews‐Hanna et al. Science 2012; science.1231753
Evans et al. (2014) JGR doi:10.1002/2013JE004494.
just after overturn cmb heatflux no water 200‐km water enriched layer 500‐km water enriched layer
no water water enriched layer temperature differnce
Scheinberg, et al., EPSL doi.org/10.1016/j.epsl.2018.04.015 (2018).
Core convection predicts magnitudes of only ~1μT For core radius 200–380 km surface dipole field 100–700 times smaller than at cmb
http://curator.jsc.nasa.gov/education/LPETSS/marebasalt.cfm#fig10
Haskin JGR (1998)
Laneuville et al., JGR 2013 Equivalent of 10 km of KREEP basalt placed below a 40 km thick crust (blue), in the lower 20 km of the crust (cross hatch), or redistributed over the entire crust (orange).
Parmentier, Zhong and Zuber 2002
Gravitational instability of a thin chemically dense (ilmenite‐rich) cumulate created during the fractionation of an anorthositic crust. Long wavelength instability needed to explain the hemispheric asymmetry. Spherical harmonic degree 1 evolves to be the fastest growing wavelength if the viscosity of the dense layer is sufficiently low relative to that of the deeper mantle.
Haoyuan Li, et al., submitted JGR (2018)
layer viscosity = 10‐3 layer thickness = 100 km layer viscosity = 10‐4 layer thickness = 100 km
Boukare, et al, (2018) EPSL.
solidification rate fast slow
Slow solidification
cumulates + retained melt cumulate compaction + buoyant melt migration
Initially molten Moon Modified from: http://www.psrd.hawaii.edu/Mar09/magmaOceanSolidification.html
Hess JGR (1994) Gross et al. ELSL http://dx.doi.org/10.1016/j.epsl.2013.12.006 (2014) Shearer et al. American Mineralogist doi.org/10.2138/am‐2015‐4817 (2015). Prissel et al. American Mineralogist doi.org/10.2138/am‐2016‐5581 (2016).
Mg‐rich cumulates
Modified from Shearer et al., New Views of the Moon, Ch. 4, 2006.
Modified from Shearer et al., New Views of the Moon, Ch. 4, 2006.
cumulates + retained melt cumulate compaction + buoyant melt migration
Initially molten Moon Modified from: http://www.psrd.hawaii.edu/Mar09/magmaOceanSolidification.html
Physical parameters with estimated values 𝑏 cumulate grain size 1 mm 𝜚 melt fraction (at deposition boundary) 50% Δ𝜛 cumulate – melt density difference 300 kg/m3 𝜊 compaction viscosity ( = cumulate viscosity/𝜚) 1017‐1019 Pa‐s 𝜈 melt viscosity 1 – 10 Pa‐s 𝑙 permeability (calculated) 3 x 10‐9 m2 𝑀 compaction length (calculated) 10‐250 km 𝑊 melt velocity (calculated) 0.01‐0.1 km/yr
Fast deposition Slow deposition 𝑙 𝜚 150 𝑏 1 𝜚 𝑊 Δ𝜛𝑙 𝜈𝜚 𝑀 𝑙 𝜊 𝜈 ⁄
Shirley, J.Geol. 1986. Both figures at same model times but note difference in vertical scale.
compacted layer thickness = 100 ‐ 1000 km
Zuber et al. (2000) Science 287, 1788‐1793.