What is Data Mining Many Definitions Search for valuable - - PowerPoint PPT Presentation

what is data mining
SMART_READER_LITE
LIVE PREVIEW

What is Data Mining Many Definitions Search for valuable - - PowerPoint PPT Presentation

What is Data Mining Many Definitions Search for valuable information in large amounts of data Automated or Semi Automated Exploration and Analysis of large volumes of data in order to discover meaningful patterns A step in KDD process


slide-1
SLIDE 1

Venkat Chalasani SRA

What is Data Mining

  • Many Definitions

Search for valuable information in large amounts of data Automated or Semi Automated Exploration and Analysis of large volumes of data in order to discover meaningful patterns A step in KDD process …

slide-2
SLIDE 2

Venkat Chalasani SRA

KDD Process

  • KDD is a non trivial process of identifying

novel valid and potentially useful patterns in data

  • Divided into

Data Collection into a Data Warehouse Data Mining

slide-3
SLIDE 3

Venkat Chalasani SRA

KDD Process -1 Data Warehousing

Operational Data Store Clean, Collect Summarize Additional Data

Data Warehouse

slide-4
SLIDE 4

Venkat Chalasani SRA

KDD Process-2 Data Mining

Data Warehouse

Data Mining Training Data Data Preparation

Models Patterns

Evaluation Deployment

slide-5
SLIDE 5

Venkat Chalasani SRA

Data Mining

  • Salient features

Large volumes of data Process for discovery information or patterns Automated or semi automated process Useful Understandable

slide-6
SLIDE 6

Venkat Chalasani SRA

Why Data Mining

  • From a scientific viewpoint

Data is collected at enormous speeds

  • Microarray experiments producing gene

expression data

  • Clinical data
  • Images

Data is heterogenous Data is stored in Relational Databases Data mining can be used for summarizing

  • Conversion into understandable form
  • Hypothesis formation
slide-7
SLIDE 7

Venkat Chalasani SRA

Origins

  • Data mining is an interdisciplinary field
  • Draws on

Computer Science

  • Databases
  • Algorithm theory
  • Machine learning/ AI

Statistics Visualization

slide-8
SLIDE 8

Venkat Chalasani SRA

Data Mining Tasks

  • Model building

Create a model that does a task in an automated manner

  • Unsupervised – dependent variable is absent
  • Supervised - dependent variable is present
  • Descriptive

Aid a human in getting information that he desires

  • Adhoc Reports
  • OLAP - FASMI
  • Visualization
slide-9
SLIDE 9

Venkat Chalasani SRA

OLAP

  • ROLAP
  • MOLAP
  • Hybrid
  • Facts or measurements about the business --
  • -Sale invoices
  • Dimensions

Products Markets Time

slide-10
SLIDE 10

Venkat Chalasani SRA

Cubes from OLAP-miner (IBM)

slide-11
SLIDE 11

Venkat Chalasani SRA

Cubes …

slide-12
SLIDE 12

Venkat Chalasani SRA

Inductive Models

Data Model Output

Known Known Fit

Unsupervised Supervised

Data Model

slide-13
SLIDE 13

Venkat Chalasani SRA

Unsupervised Models

  • Examples

Clustering Association rules Outlier detection

  • No apriori dependent variables

More flexible Difficult to evaluate accuracy Only criterion is usefulness

slide-14
SLIDE 14

Venkat Chalasani SRA

Clustering Definition

  • Given a set of data points, each having a set of

attributes and a similarity measure defined find clusters such that

Data points in a cluster are similar to each other Data points in different clusters are not similar to each

  • ther
  • Similarity Measures

Euclidean distance Pearson correlation coefficient Jaccard coefficient

slide-15
SLIDE 15

Venkat Chalasani SRA

Clustering Illustration

slide-16
SLIDE 16

Venkat Chalasani SRA

Clustering Algorithms

  • Hierarchical: A sequence of nested partitions

Agglomerative : Iterative combination of multiple partitions to form a single partition Divisive : Iterative breaking up from one partition to form multiple partitions

  • Partitional: a single set of partitions
slide-17
SLIDE 17

Venkat Chalasani SRA

Hierarchical Agglomerative Clustering

  • Dendogram representation
slide-18
SLIDE 18

Venkat Chalasani SRA

Agglomerative Clustering

  • A graphical representation
  • Nodes are merged based on a similarity

measure defined on groups

Single link join based on closest in the groups Complete link based on farthest points in the groups

slide-19
SLIDE 19

Venkat Chalasani SRA

Partitional Clustering

  • All data points divided into a fixed number of

partitions

Divide the data based on prototypes

  • Kmeans Clustering
  • Kohonen Clustering

Graph based approaches such as CAST

slide-20
SLIDE 20

Venkat Chalasani SRA

Nearest Neighbor Clustering

  • Input

A threshold t on the nearest neighbor distance A set of data points {x1,x2,…,xn}

  • Algorithm

Initialize assign set i=1, k=1 xi to Ck Set i=i+1 Find nearest neighbor of xi among points already assigned to clusters Let the nearest neighbor be in cluster m If distance to the nearest neighbor is < t

  • Assign xi to m
  • Else increment k and assign xi to Ck
  • If all points are assigned then stop
slide-21
SLIDE 21

Venkat Chalasani SRA

Clustering Applications

  • Microarray Data

Experiments Genes

slide-22
SLIDE 22

Venkat Chalasani SRA

Example of hierarchical clustering

  • Use acrobat reader
slide-23
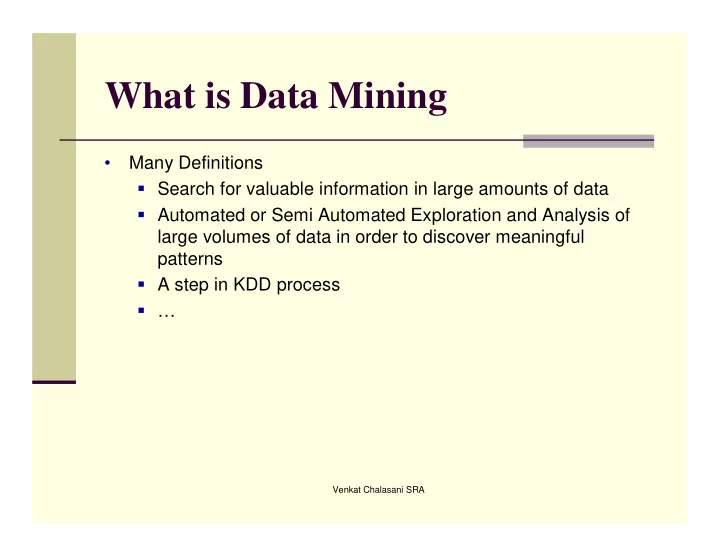
SLIDE 23

OCI Ly3 OCI Ly10 DLCL-0042 DLCL-0007 DLCL-0031 DLCL-0036 DLCL-0030 DLCL-0004 DLCL-0029 Tonsil Germinal Center B Tonsil Germinal Center Centroblasts SUDHL6 DLCL-0008 DLCL-0052 DLCL-0034 DLCL-0051 DLCL-0011 DLCL-0032 DLCL-0006 DLCL-0049 Tonsil DLCL-0039 Lymph Node DLCL-0001 DLCL-0018 DLCL-0037 DLCL-0010 DLCL-0015 DLCL-0026 DLCL-0005 DLCL-0023 DLCL-0027 DLCL-0024 DLCL-0013 DLCL-0002 DLCL-0016 DLCL-0020 DLCL-0003 DLCL-0014 DLCL-0048 DLCL-0033 DLCL-0025 DLCL-0040 DLCL-0017 DLCL-0028 DLCL-0012 DLCL-0021 Blood B;anti-IgM+CD40L low 48h Blood B;anti-IgM+CD40L high 48h Blood B;anti-IgM+CD40L 24h Blood B;anti-IgM 24h Blood B;anti-IgM+IL-4 24h Blood B;anti-IgM+CD40L+IL-4 24h Blood B;anti-IgM+IL-4 6h Blood B;anti-IgM 6h Blood B;anti-IgM+CD40L 6h Blood B;anti-IgM+CD40L+IL-4 6h Blood T;Adult CD4+ Unstim. Blood T;Adult CD4+ I+P Stim. Cord Blood T;CD4+ I+P Stim. Blood T;Neonatal CD4+ Unstim. Thymic T;Fetal CD4+ Unstim. Thymic T;Fetal CD4+ I+P Stim. OCI Ly1 WSU1 Jurkat U937 OCI Ly12 OCI Ly13.2 SUDHL5 DLCL-0041 FL-9 FL-9;CD19+ FL-12;CD19+ FL-10;CD19+ FL-10 FL-11 FL-11;CD19+ FL-6;CD19+ FL-5;CD19+ Blood B;memory Blood B;naive Blood B Cord Blood B CLL-60 CLL-68 CLL-9 CLL-14 CLL-51 CLL-65 CLL-71#2 CLL-71#1 CLL-13 CLL-39 CLL-52 DLCL-0009

2 1

  • 1
  • 2

4.000 2.000 1.000 0.500 0.250

DLBCL Germinal Center B

  • Nl. Lymph Node/Tonsil

Activated Blood B Resting/Activated T Transformed Cell Lines FL Resting Blood B CLL

Germinal Center B cell Lymph Node T cell Pan B cell Activated B cell Proliferation

A G

slide-24
SLIDE 24

Venkat Chalasani SRA

Clustering applications -documents

  • To find groups of documents that are similar

to each other

Use frequencies of words occurring within documents and a similarity measure to group documents together

  • Can be used for automatic categorization of

documents

Assigning emails automatically for complaint handling

slide-25
SLIDE 25

Venkat Chalasani SRA

Association rules

  • Given a set of records

each of which contains some items from a given collection

  • Produce dependency

rules that will predict

  • ccurrence of an item

based on occurrence of

  • ther items
  • Rules discovered
  • {Milk}

{Bread}

  • {Bread}

{Milk} Bread, milk, orange juice 5 Coke, Potato chips 4 Bagels, cream cheese, orange juice 3 Eggs, Bread, Milk 2 Bread, Milk 1

slide-26
SLIDE 26

Venkat Chalasani SRA

Association rules

  • Usefulness
  • Super market shelf arrangement
  • Product pricing and promotion
  • Predict normal behavior for Fraud detection
slide-27
SLIDE 27

Venkat Chalasani SRA

Outlier Detection

  • An interesting problem – reamins to be

solved for many practical applications

Requires a model for “normal” Lots of applications

  • Telecom fraud detection
  • Intrusion detection
  • Medicare fraud detection
slide-28
SLIDE 28

Venkat Chalasani SRA

Supervised methods

  • An output label is available for the data

Classification : the output variable is categorical

  • Classification of tissues into cancer types

Prediction : The output variable is continuous

  • Prediction of S&P 500 Index
slide-29
SLIDE 29

Venkat Chalasani SRA

Classification

  • Given a collection of records

Each record containing a set of attributes or features and a class

  • Derive a model that can assign a record to a

class as accurately as possible Set of records : training set test set k-fold Cross validation

slide-30
SLIDE 30

Venkat Chalasani SRA

Classification example IRS

No no 1 Married No 100K 7 Yes Yes 1 Single Yes 50K 6 No no 2 Married Yes 100K 5 No yes Single No 180K 4 Yes no Divorced Yes 40K 3 No no 2 Married No 100k 2 No yes 1 Single Yes 125K 1 Fraud Refu nd Child Marital Status EIC Tax. Income Row

slide-31
SLIDE 31

Venkat Chalasani SRA

Classification example IRS

? no 1 Married Yes 100K 7 ? Yes 1 Single No 70K 6 ? no 2 Married Yes 85K 5 ? yes Single No 140K 4 ? no Divorced Yes 50K 3 ? no 2 Married yes 115k 2 ? yes 1 Single No 100K 1 Fraud Refu nd Child Marital Status EIC Tax. Income Row

slide-32
SLIDE 32

Venkat Chalasani SRA

Classification Model

Training set

Training

Model

Evaluation

Test set

Class labels

slide-33
SLIDE 33

Venkat Chalasani SRA

Classification Example 1

  • Marketing response

Goal : To find a set of customers that will buy vacation property Approach:

  • Collect customer attributes

Credit score Income Other purchases

  • Create a classification model {promising, not

promising}

  • Send mail and evaluate results
slide-34
SLIDE 34

Venkat Chalasani SRA

Classification Example 2

Mortgage Loan Goal : To grant or reject loan application Approach:

  • Collect customer attributes

Credit score Income Expenses Credit history

  • Create a classification model {acceptable, not

acceptable }

  • Evaluate results
slide-35
SLIDE 35

Venkat Chalasani SRA

Classification algorithms

  • Nearest Neighbor
  • Discriminant analysis
  • Logistic Regression
  • Rule based systems
  • Decision trees
  • Support vector machines
  • Bayesian networks
slide-36
SLIDE 36

Venkat Chalasani SRA

Nearest Neighbor Algorithm

  • Define a distance measure

Euclidean distance Manhattan distance Pearson correlation coefficient Find k nearest neighbors

  • Classify to the class of the majority
slide-37
SLIDE 37

Venkat Chalasani SRA

Decision Trees

  • Repeatedly partition the feature space

IDE3 CART C4.5 Evaluate All variables/combinations Splits on single variables /combinations

  • Mutual Information
  • GINI criterion
slide-38
SLIDE 38

Venkat Chalasani SRA

Decision Trees

healthy normal regular 8 healthy normal regular 7 ill abnormal regular 6 Healthy normal regular 5 severely ill normal irregular 4 severely ill abnormal irregular 3 healthy normal regular 2 Severely ill normal irregular 1 Class Blood Pressure Heart Rate Patient No.

slide-39
SLIDE 39

Venkat Chalasani SRA

Decision Tree induced

Heart Rate Blood Pressure

ill ill healthy irregular regular normal abnormal

slide-40
SLIDE 40

Venkat Chalasani SRA

Rules Induced

  • Can give a better mental fit
  • If Heart rate is irregular then Patient is

severely ill

  • If Heart rate is normal and Blood Pressure is

abnormal then Patient is ill

  • If heart rate is normal and blood pressure is

normal then patient is healthy

slide-41
SLIDE 41

Venkat Chalasani SRA

Prediction

  • Given a collection of records

Each record containing a set of attributes or features including a dependent variable

  • Derive a model that can predict the

dependent variable as accurately as possible from the rest of the attributes Set of records : training set test set k-fold Cross validation

slide-42
SLIDE 42

Venkat Chalasani SRA

Prediction Example 1

  • Credit score

Goal: To assign a score to each individual that is an indicator of loan default Approach:

  • Collect training set

Credit history Outstanding balances Rent or own Loan defaults

  • Create a prediction model
slide-43
SLIDE 43

Venkat Chalasani SRA

Prediction Example 2

Weather forecasting Goal: Predict probability of rain one day in advance Approach: Collect past data humidity pressure temperature rainfall Create a prediction model

slide-44
SLIDE 44

Venkat Chalasani SRA

Prediction Algorithms

  • Linear Regression
  • Polynomial Nets
  • Neural Networks
  • Multiple Adaptive Regression Splines
slide-45
SLIDE 45

Venkat Chalasani SRA

Products- Adhoc queries/reports

Business Objects Impromtu from Cognos GQL from Anadyne Browser from Oracle Brio Query from Brio technology Discoverer from Oracle

slide-46
SLIDE 46

Venkat Chalasani SRA

Products OLAP

  • Microsoft
  • Hyperion
  • Cognos
  • Business Objects
  • Microstrategy
  • SAP
  • Oracle
slide-47
SLIDE 47

Venkat Chalasani SRA

Products - Modeling

General Clementine from SPSS Enterprise Miner from SAS Oracle Data Mining Suite Oracle 9i IBM Intelligent miner for data IBM intelligent miner for text Specific: CART Neuroshell Public domain: MLC++ WEKA R

slide-48
SLIDE 48

Venkat Chalasani SRA

Text Mining

  • Text data is unstructured

A collection of documents

  • Each document is a collection of words
  • Few cases class label

NLP based approaches

  • Natural language understanding

Statistics based approaches Mixed approaches

slide-49
SLIDE 49

Venkat Chalasani SRA

Text Mining – NLP based approaches

  • Based on understanding of a language

information can be extracted through patterns

Can be used directly Convert into structured data

slide-50
SLIDE 50

Venkat Chalasani SRA

Statistics based approaches

  • Need to handle sparse data

Lots of possible words Each document contains only a few words 10100000001010100010000010100000000

  • TFIDF

Term Frequency Inverse document frequency

  • Text clustering

TFIDF approaches

  • Text classification
slide-51
SLIDE 51

Venkat Chalasani SRA

Text Clustering

  • Goal: Divide a set of documents into groups

where the number of groups is not known

  • Approach:

Define a distance measure suitable for binary sparse vectors

  • Commonly used is the cosine distance

x .y/(|x||y|) Use modifications of algorithms that can handle large data size

slide-52
SLIDE 52

Venkat Chalasani SRA

CNN and Reuters news stories Jan-Feb 95

Russian grozn yeltsin chechnya 93 Japan kobe earthquake 97 Israel palestine gaza peace arafat 98 Simpson trial jury prosecute 217 clinton congress house amend 330 Top ranking words per cluster Size

slide-53
SLIDE 53

Venkat Chalasani SRA

Document Classification

  • Goal : Classify email into spam and non spam
  • Approach:

Create a corpus of spam and non spam email Train a text classifier (naïve bayes) Evaluate on a test set Accuracy obtained was of the order 99.85%

slide-54
SLIDE 54

Venkat Chalasani SRA

Questions