
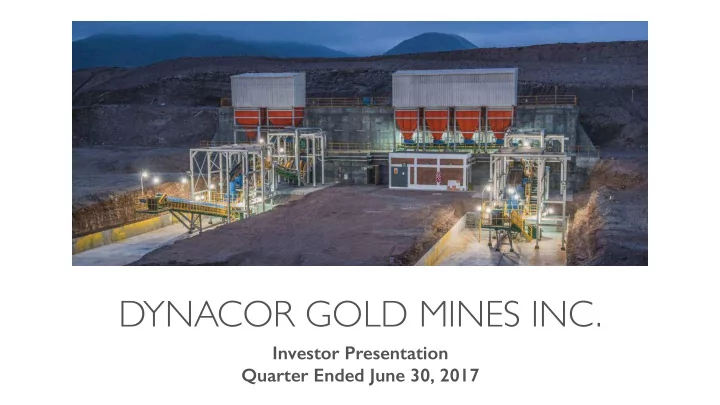
SLIDE 1
DYNACOR GOLD MINES INC.
Investor Presentation Quarter Ended June 30, 2017
DYNACOR GOLD MINES INC. Investor Presentation Quarter Ended June - - PowerPoint PPT Presentation
DYNACOR GOLD MINES INC. Investor Presentation Quarter Ended June 30, 2017 dynacor.com DNG:TSX | DNGDF:OTC A GOLD PRODUCTION CORPORATION A proven leader in a unique niche of the metals and mining sector A 19 year track record of
Investor Presentation Quarter Ended June 30, 2017
and mining sector
Peru
reputation and strong relationships
in Peru
2
DNG:TSX | DNGDF:OTC dynacor.com
Market Summary Stock Price $2.07 (CAD) | $1.49 (US) Ticker Symbol DNG (TSX) | DNGDF (OTC) Shares Outstanding (Basic) 38.7 Million Average Daily Volume (Shares) 49,600 (TSX) Monthly Dividend NA Dividend Yield NA Director and Senior Management Ownership 795,151 Capital Structure Market Capitalization CAD $80.1 Million Enterprise Value US $65 Million Debt US $5.3 Million*
*Subsequent to quarter-end, Dynacor executed a partial prepayment of $1-million on its outstanding debt, reducing the total principal balance owed to $5.3-million. The Corporation intends to reduce the outstanding balance as soon as it secures sufficient liquidity and expects that at least one and possibly two additional partial prepayments will occur by the end of 2017.
3
DNG:TSX | DNGDF:OTC dynacor.com
$0.43 $0.86 $1.29 $1.71 $2.14 $2.57 $3.00 Dec-2007 Dec-2008 Dec-2009 Dec-2010 Dec-2011 Dec-2012 Dec-2013 Dec-2014 Dec-2015 Dec-2016
4
DNG:TSX | DNGDF:OTC
2016 Market Capitalization $96.8M 2008 Market Capitalization $3.6M
dynacor.com
2007 Listed
DNG
steady dividend history)
5
DNG:TSX | DNGDF:OTC dynacor.com
Gold Production (oz) 35,000 70,000 105,000 140,000 2011 2012 2013 2014 2015 2016 2017T 2018T 2019T 2020T
Gold Production Target (oz)
6
P r
u c t i
G r
t h
DNG:TSX | DNGDF:OTC dynacor.com
Sales ($CAD Millions) $0 $50 $100 $150 $200 2016 Actual 2017T 2018T 2019T 2020T
Sales Actual & Targets Linear Trendline
7
*Targets based on US$ 1200 gold price; 38.7M shares outstanding;1.25 US to CAD exchange rate; future production growth targets DNG:TSX | DNGDF:OTC dynacor.com
(average for 6 month period ended June 30, 2017)
exchange rate
33% in 2018; 9% in 2019 and 14% in 2020)
Sales & Cash Flow Targets (2018-2020)
CAD ($MILLIONS)
$1100 $1200 $1300 $1400 $1500
2018T SALES $148.7 $162.2 $175.8 $189.3 $202.8 CASH FLOW $10.1 $11.0 $12.0 $12.9 $13.8 2019T SALES $168.3 $183.6 $198.9 $214.2 $229.5 CASH FLOW $11.4 $12.5 $13.5 $14.6 $15.6 2020T SALES $180.1 $196.5 $212.9 $229.3 $245.7 CASH FLOW $12.2 $13.4 $14.5 $15.6 $16.7
8
DNG:TSX | DNGDF:OTC dynacor.com *Target based on 2017 CF average of 6.8% from gold sales; 38.7M shares outstanding;1.25 US to CAD exchange rate; future production growth targets
LIMA CUZCO
‘Las Bambas’ Cu/Au Porphyry 1.7Bt, 0.60% Cu SOLD FOR $6 BILLION TO CHINA
‘Constancia’Cu /Au Porphyry 277Mt, 0.43% Cu SOLD FOR $520M ‘Haquira’ Cu/Au Porphyry 569Mt, 0.64% Cu SOLD FOR $460M
US$ 8 billion in mine development and 3.6 billion tons of ore surround Tumipampa
9
DNG:TSX | DNGDF:OTC dynacor.com
Minera Del Norte SA Barrick Yamana Gold Iamgold Southern Peru Anglo American Bear Creek Fresnillo Peru Golden Ideal Mining
characteristics to Barrick’s Lagunas Norte mine;
Orcopampa, owned by Buenaventura;
the zone is marginal and irregular, however, the existence of this mineralization in the project confirms the presence of geological activity creating favourable conditions to the other zones * Confirmation of the mineralized zones are supported by diamond drill holes, geochemical, geophysical studies together with underground workings in the high-grade gold vein system
Tumipampa;
way access;
in Peru: .
vein mines such as Orcopampa, owned by Buenaventura;
corporations such as Las Bambas, owned by MMG Dynacor owns 100% of the Tumipampa project
10
DNG:TSX | DNGDF:OTC dynacor.com
Tumipampa is a large 9,756 ha advanced stage gold exploration project located in the south central Andes of Peru
Leading the way in social accountability and responsibility Dynacor has a strong ongoing commitment to the communities that live around its
Dynacor’s CSR investments are focused on education, health and community based sustainable sources of income In the second semester of 2017, Dynacor is planning to fund new modernized medical equipment for one of its key mining suppliers and their community In May 2016, Dynacor funded a community and school library for the Pachaconas community Since 2014, Dynacor has provided computers and courses to more than 60 school children in the Pampallacta community
11
DNG:TSX | DNGDF:OTC dynacor.com
upside
long-term
growing production, cash flow, future dividends per share and executing our low risk exploration development plan
12
DNG:TSX | DNGDF:OTC dynacor.com
Firm Analyst Phone Email Keystone Financial Ryan Irvine/Aaron Dunn 604.273.1118 rirvine@keystocks.com Fundamental Research Corp Siddharth Rajeev 604.682.7065 srajeev@frcresearch.com
DNG:TSX | DNGDF:OTC
DISCLAIMER: Please note that any opinions, forecasts or recommendations regarding Dynacor’s performance are made by these analysts and do not necessarily represent the opinions, forecasts or recommendations of Dynacor or its management. Dynacor does not warrant the accuracy of statements contained in any analyst’s report and undertakes no responsibility for correcting or updating any analyst’s report or any information contained therein. Dynacor does not, by its reference herein imply any endorsement of or concurrence with such information, conclusions or recommendations.
13
dynacor.com
This presentation contains certain forward-looking statements regarding operational information, future exploration and development plans and anticipated future production. Words such as, potential”, “building” “inferred”, “if”, “will”, “expect”, “forecast”, “estimate”, “consider”, “may”, “possible” and similar expressions have been used to identify these forward-looking statements. These statements are management’s current beliefs and are based on information currently available to management. Forward-looking statements involve significant risk and uncertainties. A number of factors could cause actual results to differ materially from the results discussed in the forward-looking statements including, but not limited to, changes in general economic, political and market conditions and other risk factors. Although the forward- looking statements contained herein are based upon what management believes to be reasonable assumptions, management cannot assure that actual results will be consistent with these forward-looking statements. Investors should not place under reliance forward-looking statements. Forward-looking statements and other information contained herein concerning the metals and mining industry and Dynacor’s general expectations concerning the industry are based on estimates prepared by management using data from publicly available industry sources as well as from private sources, industry analysis and on assumptions based on data and knowledge of the this industry which the Company believes to be reasonable. However, this data is inherently imprecise. While Dynacor is not aware of any misstatements regarding any industry data presented herein, the industry involves risks and uncertainties and is subject to change based on various factors. There is no certainty the projections will be met.
14
DNG:TSX | DNGDF:OTC dynacor.com