
SLIDE 1
- DSN Group Q1 2018 Results Update
DSN Group Q1 2018 Results Update - - PDF document
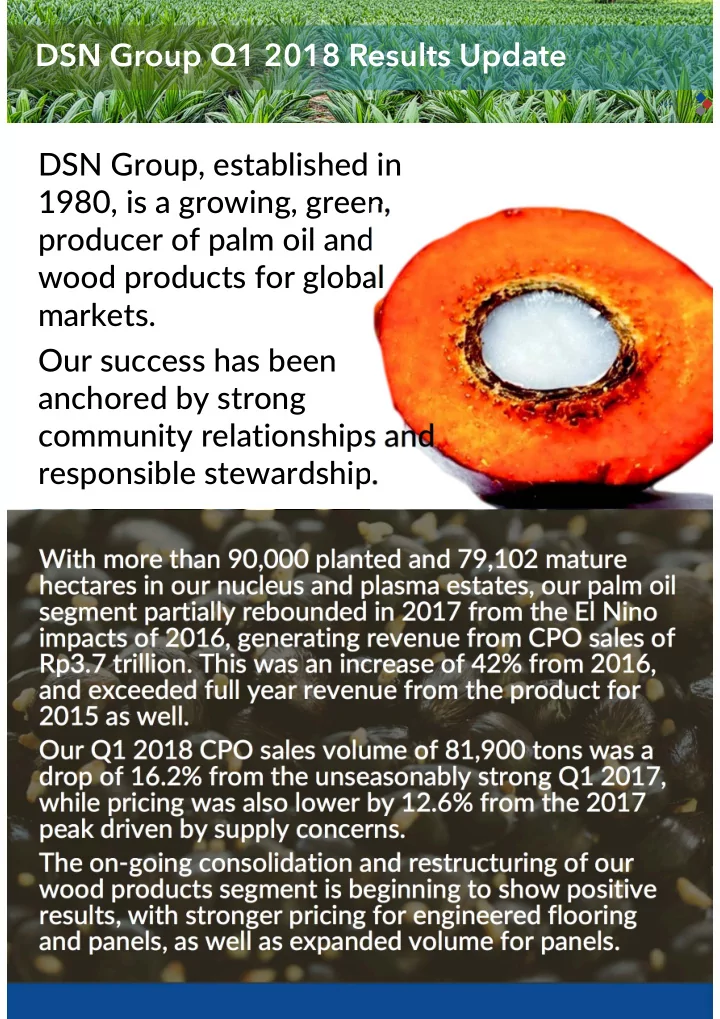
DSN Group Q1 2018 Results Update
=1,000ha
=1,000ha
Mill 7 Mill 3 Mill 1 Mill 4 Mill 2 Existing CPO Mills Trans-East Kal. Hwy DWT DIN SWA DAN KPS
DSN Estates DSN Customers DSN Ports
* Restated **Total debt excludes debt backed by restricted cash
performance, outcomes and results may differ materially from those expressed in forward-looking statements as a result of a number of risks, uncertainties and assumptions. Although the Company believes that such forward-looking statements are based on reasonable assumptions, it can give no assurance that such expectations will be met. You are cautioned not to place undue reliance on these forward looking statements, which are based on the current view of the management on future events. Unless otherwise stated, the Company is the source for all data contained in this presentation. Such data is provided as at the date of this presentation and is subject to change without notice. No reliance may be placed for any purposes whatsoever on the information contained in this presentation, or any other material discussed at the presentation, or on the completeness, accuracy
The information in this presentation has not been independently verified. No representation, warranty, express or implied, is made as to, and no reliance should be placed on, the fairness, accuracy, completeness or correctness of the information and
events or otherwise and none of them shall have any liability (in negligence or otherwise) for any loss howsoever arising from any use of this presentation or its contents or otherwise arising in connection with this presentation. This presentation also contains certain statistical data and analyses which have been prepared by the Company and/or other
particular context, nor as to whether the Statistical Information and/or the assumptions upon which they are based reflect present market conditions or future market performance.