
SLIDE 1
PT DSN Tbk Q1 ‘14 Results Update
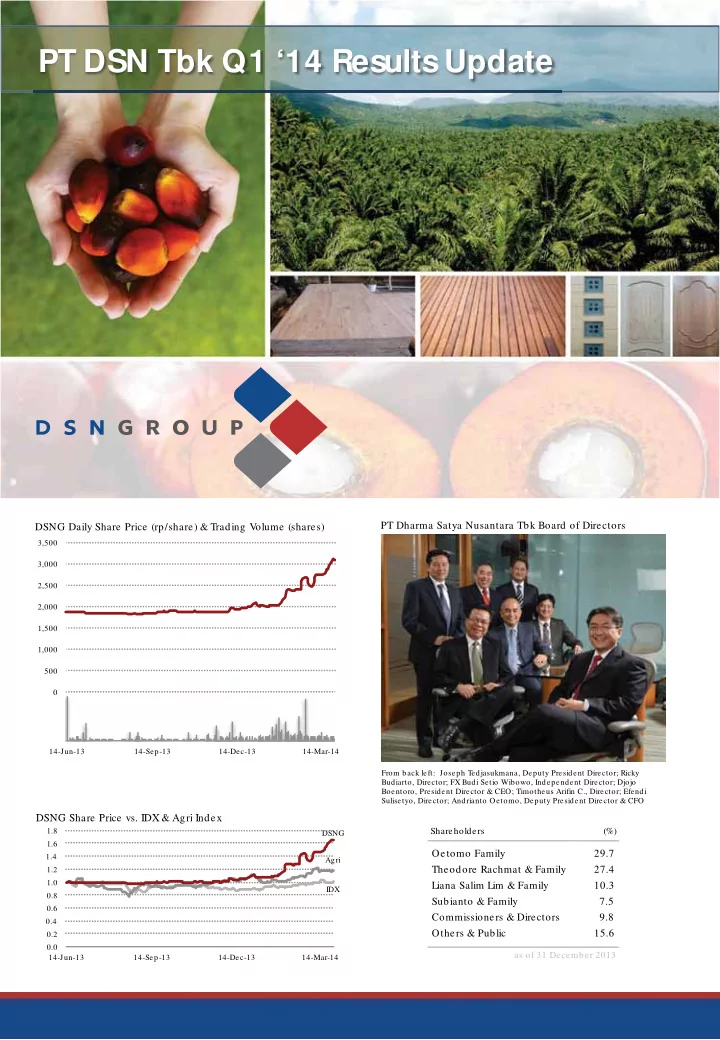
DSNG Daily Share Price (rp/share) & Trading V- lume (shares)