
SLIDE 1
Drift, mutation, selection, and the evolutionary dispersion of mean - - PowerPoint PPT Presentation
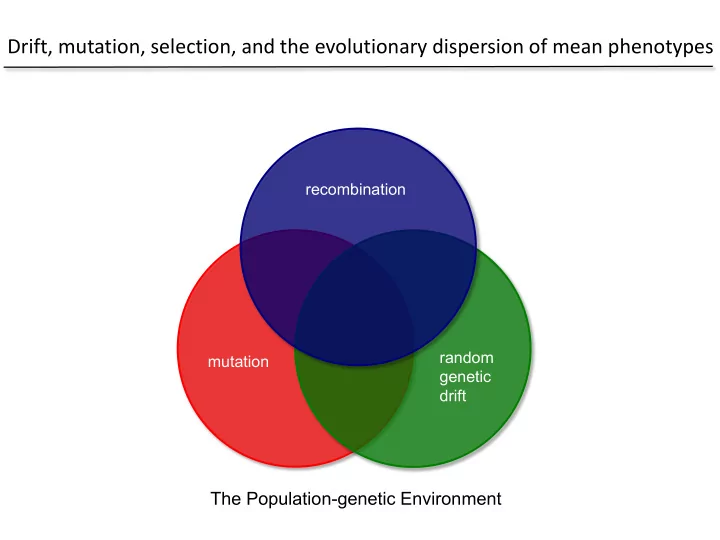
Drift, mutation, selection, and the evolutionary dispersion of mean phenotypes recombination random mutation genetic drift The Population-genetic Environment 1000x Range of Variation in the Mutation Rate The mutation rate per nucleotide
10-8 10-7 10-6 10-5 10-4 10-3 10-2 10-1 100 101 102 103 104 105 106 107 108 109 1010 1011
104 105 106 107 108 109 Bacteria Unicellular eukaryotes Invertebrates Vertebrates Land plants
population mean population distribution genotype-specific distributions
Col 1 vs Col 3 Col 5 vs Col 6 Col 8 vs Col 9 Col 11 vs Col 12 Col 14 vs Col 15 Col 17 vs Col 18 Col 20 vs Col 21
drift
selection mutation bias drift
4μ01 · φ01 μ10 · φ10 2μ01 · φ23 3μ10 · φ32 3μ01 · φ12 2μ10 · φ21 μ01 · φ34 4μ10 · φ43
104 105 106 107 108 109
0.0 0.2 0.4 0.6 0.8 1.0
= 0.0, = 103 = 0.0, = 104 = 0.5, = all = 1.0, = 103 = 1.0, = 104
Effective Population Size
106 107 108 109
Mean Phenotype
0.0 0.5 1.0 1.5 2.0
= 1.0 = 1.5 = 2.0
106 107 108 109
Mean Haplotype Frequency
0.0 0.2 0.4 0.6 0.8 1.0
Optimum phenotype:
Effective Population Size
105 106 107 108 109
Mean Allelic Type
1 2 3 4 5
1.0 1.5 2.0 2.5 3.0 3.5 4.0 4.5 5.0
105 106 107 108 109
Mean Allelic Type
1 2 3 4 5
2 5 10 20 30 50
Optimum phenotype, = Number of sites =
5 10 15 20 25 10-5 10-4 10-3
N = 105, s = 0.01, k = 0.02, ∆U = 0.1U
100 200 300 400 500 10-7 10-6 10-5
N = 107, s = 0.01, k = 0.02, ∆U = 0.1U
Mean Genome-wide Deleterious Mutation Rate Generations (106)
Population size = 105 Population size = 107
Fenchel (1974, Oecologia) Metabolic Rate per unit Weight in Mammals Savage et al. (2007, PNAS)
Mass at Maturity (g)
10-910-810-710-610-510-410-310-210-11001011021031041051061071081091010
Maximum Exponential Growth Rate (days-1)
10-3 10-2 10-1 100 101 102 Bacteria Yeasts Amoebozoa Ciliates Rotifers Crustaceans Nematodes Cnidarians Molluscs Annelids
Mass at Maturity (g)
10-810-710-610-510-410-310-210-1 100 101 102 103 104 105 106 107 108 1091010
Maximum Exponential Growth Rate (days-1)
10-3 10-2 10-1 100 101 102 Cyanobacteria Green algae Diatoms Dinoflagellates Cryptophytes Haptophytes Herbaceous angiosperms
dimer tetramer trimer hexamer heptamer
pentamer monomer
Eubacteria Archaea Uni.Euks. Land plants Metazoans Hexokinase Glucose 6-phosphate isomerase Phosphofructokinase Fructose bisphosphate aldolase Triosephosphate isomerase Glyceraldehyde phosphate dehydrogenase Phosphoglycerate kinase Phosphoglucomutase Enolase Pyruvate kinase Citrate synthase Isocitrate dehydrogenase Fumarase Malate dehydrogenase Citrate synthase Isocitrate dehydrogenase Fumarase Malate dehydrogenase
Monomer Dimer Trimer Tetramer Hexamer Octamer Monomer Dimer Trimer Tetramer Hexamer Octamer Glycolysis: Citric-acid cycle:
(Griffin et al. 2008).
Eubacteria (n = 4269)
0.0 0.2 0.4 0.6 0.8
Archaea (n = 455) Unicellular Eukaryotes (n = 630)
0.0 0.2 0.4 0.6 0.8
Invertebrates (n = 141) Vertebrates (n = 3271)
2 4 6 8 10 12 14 0.0 0.2 0.4 0.6 0.8
Land Plants (n = 206)
2 4 6 8 10 12 14
independent of phylogenetic lineage.
negative exponential in form.
with organismal complexity, which is dramatically different than what we see gene structure and genomic architecture.
u 3v 2v v u u upward selection pressure downward selection pressure
10 20 30
0.0 0.1 0.2 0.3 0.4 0.5
0.1 1.0 2.0 10.0 20.0