
SLIDE 1
1
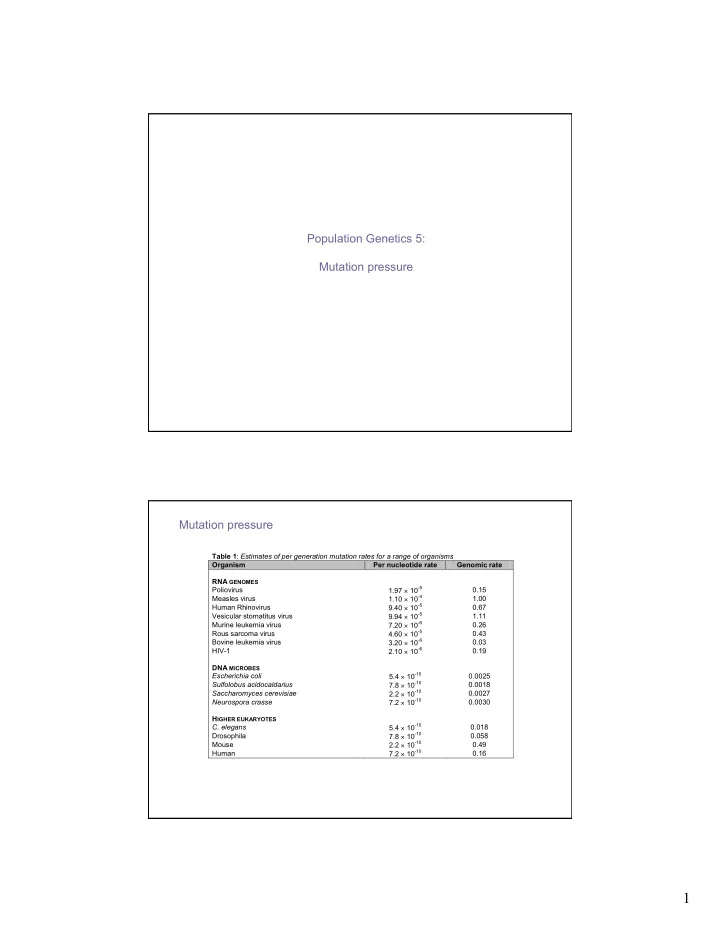
Population Genetics 5: Mutation pressure
Table 1: Estimates of per generation mutation rates for a range of organisms Organism Per nucleotide rate Genomic rate RNA GENOMES Poliovirus 1.97 × 10⁻⁵ 0.15 Measles virus 1.10 × 10⁻⁴ 1.00 Human Rhinovirus 9.40 × 10⁻⁵ 0.67 Vesicular stomatitus virus 9.94 × 10⁻⁵ 1.11 Murine leukemia virus 7.20 × 10⁻⁶ 0.26 Rous sarcoma virus 4.60 × 10⁻⁵ 0.43 Bovine leukemia virus 3.20 × 10⁻⁶ 0.03 HIV-1 2.10 × 10⁻⁶ 0.19 DNA MICROBES Escherichia coli 5.4 × 10⁻¹⁰ 0.0025 Sulfolobus acidocaldarius 7.8 × 10⁻¹⁰ 0.0018 Saccharomyces cerevisiae 2.2 × 10⁻¹⁰ 0.0027 Neurospora crasse 7.2 × 10⁻¹⁰ 0.0030 HIGHER EUKARYOTES
- C. elegans