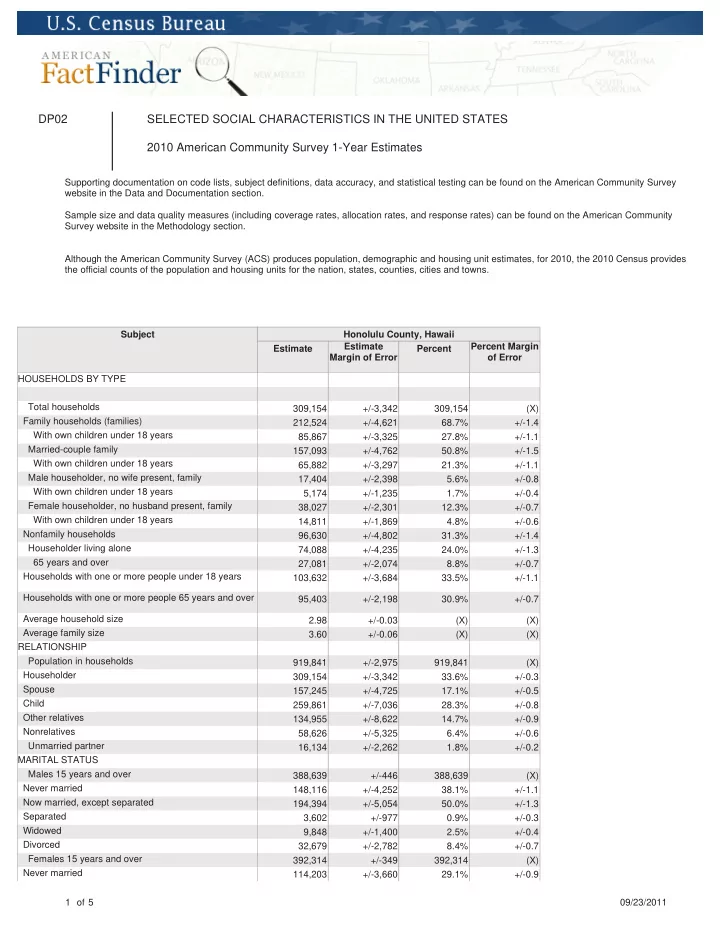

DP02 SELECTED SOCIAL CHARACTERISTICS IN THE UNITED STATES 2010 American Community Survey 1-Year Estimates
Supporting documentation on code lists, subject definitions, data accuracy, and statistical testing can be found on the American Community Survey website in the Data and Documentation section. Sample size and data quality measures (including coverage rates, allocation rates, and response rates) can be found on the American Community Survey website in the Methodology section. Although the American Community Survey (ACS) produces population, demographic and housing unit estimates, for 2010, the 2010 Census provides the official counts of the population and housing units for the nation, states, counties, cities and towns. Subject Honolulu County, Hawaii Estimate Estimate Margin of Error Percent Percent Margin
- f Error
HOUSEHOLDS BY TYPE Total households 309,154 +/-3,342 309,154 (X) Family households (families) 212,524 +/-4,621 68.7% +/-1.4 With own children under 18 years 85,867 +/-3,325 27.8% +/-1.1 Married-couple family 157,093 +/-4,762 50.8% +/-1.5 With own children under 18 years 65,882 +/-3,297 21.3% +/-1.1 Male householder, no wife present, family 17,404 +/-2,398 5.6% +/-0.8 With own children under 18 years 5,174 +/-1,235 1.7% +/-0.4 Female householder, no husband present, family 38,027 +/-2,301 12.3% +/-0.7 With own children under 18 years 14,811 +/-1,869 4.8% +/-0.6 Nonfamily households 96,630 +/-4,802 31.3% +/-1.4 Householder living alone 74,088 +/-4,235 24.0% +/-1.3 65 years and over 27,081 +/-2,074 8.8% +/-0.7 Households with one or more people under 18 years 103,632 +/-3,684 33.5% +/-1.1 Households with one or more people 65 years and over 95,403 +/-2,198 30.9% +/-0.7 Average household size 2.98 +/-0.03 (X) (X) Average family size 3.60 +/-0.06 (X) (X) RELATIONSHIP Population in households 919,841 +/-2,975 919,841 (X) Householder 309,154 +/-3,342 33.6% +/-0.3 Spouse 157,245 +/-4,725 17.1% +/-0.5 Child 259,861 +/-7,036 28.3% +/-0.8 Other relatives 134,955 +/-8,622 14.7% +/-0.9 Nonrelatives 58,626 +/-5,325 6.4% +/-0.6 Unmarried partner 16,134 +/-2,262 1.8% +/-0.2 MARITAL STATUS Males 15 years and over 388,639 +/-446 388,639 (X) Never married 148,116 +/-4,252 38.1% +/-1.1 Now married, except separated 194,394 +/-5,054 50.0% +/-1.3 Separated 3,602 +/-977 0.9% +/-0.3 Widowed 9,848 +/-1,400 2.5% +/-0.4 Divorced 32,679 +/-2,782 8.4% +/-0.7 Females 15 years and over 392,314 +/-349 392,314 (X) Never married 114,203 +/-3,660 29.1% +/-0.9 1 of 5 09/23/2011