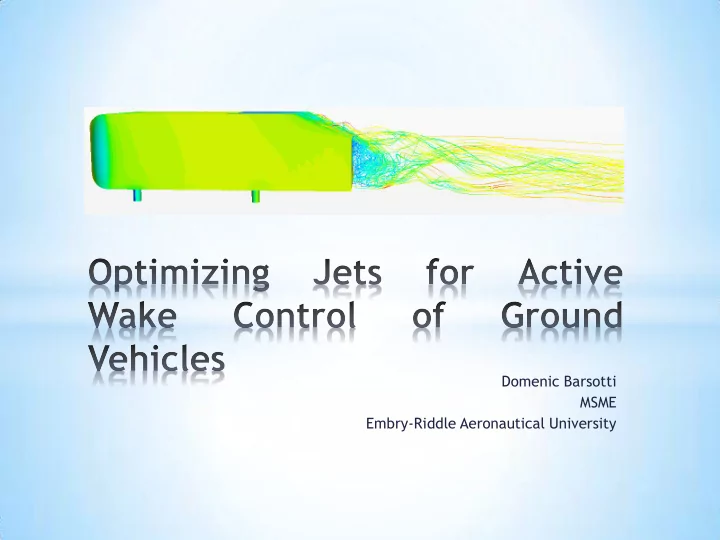
SLIDE 1
Domenic Barsotti MSME Embry-Riddle Aeronautical University
SLIDE 2
*Introduction *Real World Implications *Problem Description *Initial Simulations *Optimizations *Results Analysis *Future Work
SLIDE 3
*Environmental Impact
*Current trends to reduce independence on oil
* Development of Hybrid vehicles * Development of aerodynamically efficient vehicles
*Drag is the leading negative force above 45 mph
*Current Drag Reduction Systems (DRS)
*Active Aero (rear wings, duct closing) *Smooth under panels
SLIDE 4 *Values are for 2013 Chevrolet Malibu
10% Mass Delta 10% Crr Delta 10% CD Delta Energy Consumption [%] 6.47 1.91 3.49
SLIDE 5 *In 1984, Ahmed{1} proposed a bluff body to
simulate vehicle drag
*Angle of slant varies from 0º-90º *25º slant angle is most commonly used for typical
automobile simulations
{1} Ahmed, Ramm, Faltin (1984) “Some Salient Features of the Time-Averaged Ground Vehicle Wake” SAE 840300
SLIDE 6
*Domain is 1.4m x 1.86m x 8.5m
*Blockage ratio= 4.3%
*Mesh Continua
*Polyhedral Mesher *Prism Layer Mesher *Surface Remesher
SLIDE 7 *Base Size = 0.005 m *Mesh Independence *20.5 million cells
0.35 0.355 0.36 0.365 17 22 27 Cd Cell Count (millions)
Mesh Independence
SLIDE 8
*Implicit Unsteady *Constant Density *Segregated Flow Solver *SST K-Omega DES Turbulence Model
*Improved Delayed Detached Eddy Simulation
*Turbulence Viscosity Ratio – 200 *Turbulence Intensity – 0.02 *Time Step = 0.001 s *Total Simulation time = 1.5 s
SLIDE 9 *Initial Simulation was compared to experiment {2}
*Reynolds Number Sweep from 1.4 to 2.8 million *Inlet Velocity 21 m/s to 42 m/s *Drag averaged from Time = 0.75 s to 1.5 s *Re = 1.4 million was chosen for highest Cd (0.371)
{2} Joseph, Amandolese, Aider (2012) “Drag Reduction on the 25º slant angle Ahmed reference body using pulsed jets” Exp Fluids
0.3 0.31 0.32 0.33 0.34 0.35 0.36 0.37 0.38 1.2 1.7 2.2 2.7 3.2 Cd Re (millions) Experimental {2} CFD
SLIDE 10
*Jets implemented at rear end *4 Variables- velocity
*15m/s – 40 m/s
*Drag averaged from 0.75 -1.5
sec
*Objective function = minimize
average Cd
*30 iterations
SLIDE 11
*Optimal Value was minimums (all jets 15 m/s) *Optimized Cd = 0.336 (9.4% reduction)
*10 m/s jets showed increase (Cd=0.339)
*Showed critical information
*Max drag reduction with jet velocities equal *Bottom and side jets were too thin to be
effective
SLIDE 12
No Jets Optimized Jets (15 m/s)
SLIDE 13
*All jets changed to 10 mm thick
*Bottom and side jets were 5mm
*All velocities set equal *1 Variable – velocity 8 m/s – 20 m/s *Objective function- Minimize Averaged Drag *30 iterations
SLIDE 14 0.31 0.315 0.32 0.325 0.33 0.335 0.34 0.345 8 10 12 14 16 18 20 Averaged Cd Velocity (m/s)
Optimized Cd = 0.316 (10.28 m/s)
SLIDE 15
*Averaged Cd = 0.316 (14.8% reduction) *Jet velocity of 10.28 m/s
SLIDE 16
*Design Exploration conducted using Optimate *Angle of bottom jet (0,5,10,15,20, 25º) *Height of top jet (39.2, 27.2, 15.2, 3.2 mm) *Conducted at 15 m/s jet velocity
SLIDE 17
* Found to be a non-critical
dimension
* Averaged Cd range (0.331-
0.334) > 1% difference
* Costly computationally
(requires remesh)
* Future optimizations to not
include
* Value of mild significance * 25 degrees – Cd= 0.3255
3% reduction compared to 0 degree
* Other angles were within 1
count of each other
* Less computational (no
remesh required)
SLIDE 18
*All jets 10 mm thickness *Bottom jet angle increased to 25º *Top jet left at 39.2 mm distance *1 design variable- velocity *15 iterations *Objective function – minimize averaged Cd
SLIDE 19 0.31 0.312 0.314 0.316 0.318 0.32 0.322 0.324 0.326 0.328 9 10 11 12 13 14 15 Cd Jet Velocity (m/s)
Optimized Cd = 0.312 (10.2 m/s)
SLIDE 20
*Critical Values found
*Velocity (easily optimized- no remesh) *Angle (easily optimized- no remesh)
*Non-critical values found
*Distance of jets to edge
*Reduced drag by 16%
SLIDE 21
No Jets Cd = 0.371 Optimized Jets Cd = 0.312
SLIDE 22
No Jets Cd = 0.371 Optimized Jets Cd = 0.312
SLIDE 23
*Determine impact of side jets *Investigate suction along top slant *Test jet system experimentally *Implement on full scale production vehicle
SLIDE 24
Domenic Barsotti
BarsottD@my.erau.edu