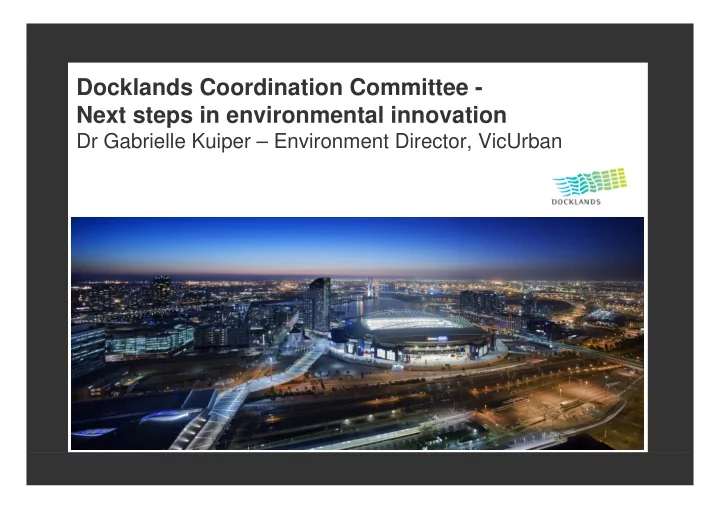

Docklands Coordination Committee - Next steps in environmental innovation Dr Gabrielle Kuiper – Environment Director, VicUrban
First Decade of Docklands – Environmental innovation • Melbourne Docklands ESD Guide 2002, updated 2006 • Championed integrated stormwater treatment in a high density area • Early delivery of tram services
First Decade - Green Star certified buildings in Docklands Goods Shed Media House National Foods 370 Docklands Drive AXA Port 1010 KB TAFE ANZ Convesso Myer The Gauge Green Star- Office Design Green Star – Office As-built Green Star – Multi Unit Residential PILOT
National Australia Bank Features: • Mixed-mode ventilation • Sunlight penetration 268,000 (26%) • Glare screens • Office equipment selection
The Gauge Features: • Gas-fired co-generation • Sub-metering 268,000 (26%) • Efficient lighting design • Passive chilled beam system • Air supply pre-heat
ANZ Features: • Renewable electricity • Gas-fired tri-generation plant 268,000 (26%) • Displacement ventilation system • External shading • River cooling • Green roof
VicUrban’s offices - Goods Shed Features: • Active chilled beam system • Underfloor ventilation system 268,000 (26%) • Energy efficient whitegoods • High-efficiency lighting • Gas-fired co-generation
Kangan Batman TAFE Features: • BATISO slab cooling system • Active chilled beams 268,000 (26%) • Night cooling • Thermal chimney • Natural daylight • Mixed-mode ventilation
Water Sensitive Urban Design • Stormwater treatment in the roads – tree pits & biorentention swales 268,000 (26%) • Water tanks underground in 4 parks: 50,000L to 580,000L
Docklands development over the first decade Complete / Under Forecast % Construction Residential Apartments 8,650 3,260 37.6 Commercial Office (GLA) 1 350 000 438 000 32.5 Retail (GLA) 190 000 107 600 56.6 Hotel (GLA) 79 700 19 500 24.47 Other 146,087 70,534 48.3
Approach for the Second Decade of Docklands Docklands Environmental Sustainability Innovation Initiatives 3. Precinct Level Continuous Improvement innovation 2. Multi- precinct innovation - especially energy & water supply 1. Continuous improvements - especially building scale energy and water efficiencies Benchmark Current Performance
Total predicted energy use 450 371GWh/year 400 Best practice in Docklands (buildings) 334 (10%) 350 Worlds best practice (buildings) 311 (16%) 300 GWh/year 250 199GWh/year 200 150 100 50 0 Current Full build out
Commercial energy demand (2008) 300 250 Energy Demand (kWh/m2) 200 150 100 50 0 Australian Best Practice Precincts World Leadership
Residential energy demand (2008) 160 140 Energy Demand (kWh/m2) 120 100 80 60 40 20 0 Australian Best Practice Precincts World Leadership
Key Initiatives - Docklands clean energy supply Building Integrated PV Roof Mounted Wind Roof Mounted PV Tower Mounted Wind Public Space PV Cogeneration Solar water heating Trigeneration
Clean energy supply options assessment C a r b o n P o l lu t i o n R e d u c t io n % 125 BIPV 100 C a p it a l C o s t $ m illi o n Roof mounted PV 75 Tri-gen 50 Solar Water Heating Cogen Public Space PV 25 Tower-mounted Wind Roof-mounted Wind 0 0 10 20 30 40 50 C o n t r i b u t i o n t o T o t a l E n e r g y D e m a n d %
D2 - Under investigation - Tri-generation
D2 - Under investigation - Tri-generation Capacity: 31.5MW Tri-generation hubs Stage 1 reticulation Stage 2 reticulation
D2 – Docklands total predicted water use 2250 2,095 2000 Best practice in Docklands (buildings) 1,915 (9%) 1750 World best practice (buildings) 1,665 (21%) 1500 ML/year 1250 955 1000 750 500 250 0 Current Future
Commercial water demand (2008) 0.9 0.8 0.7 Water Demand (kL/m2) 0.6 0.5 0.4 0.3 0.2 0.1 0 Australian Best Practice Precincts World Leadership
Residential water demand (2008) 1.6 1.4 1.2 Water Demand (kL/m2) 1 0.8 0.6 0.4 0.2 0 Australian Best Practice Precincts World Leadership
Water Supply Options – Water Mains Through Docklands Stormwater Drain Sewer Main
Potable Substitution 438ml/y D2 - Under investigation - Sewer Mining Sewer mining
D2 – Under Investigation - Stormwater Harvesting Stormwater Harvesting Potable Substitution 268ml/y
D2 - Stormwater Harvesting and Reuse Project • Investigation in partnership with City West Water • Sub-surface storage: 10ML • Treatment capacity: ~ 750 kL/day • Local capture and use of rainwater & stormwater will continue
Next steps • Second Decade of Docklands consultation process in 2010 • Stakeholder engagement eg: • City of Melbourne • Melbourne Water • Regulators (Department of Health etc.) • Further investigation of viability of trigeneration at scale • Stormwater Harvesting concept plan confirmation and functional design
Recommend
More recommend