Do EPDs Work? and the Need for More Demonstration Projects of - - PDF document

do epds work
SMART_READER_LITE
LIVE PREVIEW

Do EPDs Work? and the Need for More Demonstration Projects of - - PDF document

Tom Brink, Red Angus Association of 6/2/17 America Field Testing $Beef in Purebred Angus Cattle Do EPDs Work? and the Need for More Demonstration Projects of Similar Kind Not everyone is convinced. Tom Brink, Red Angus Association of


slide-1
SLIDE 1

Tom Brink, Red Angus Association of America 6/2/17 2017 BIF Symposium, Athens, Ga. 1 Field Testing $Beef in Purebred Angus Cattle

…and the Need for More Demonstration Projects of Similar Kind

Tom Brink, Red Angus Association of America

Do EPDs Work?

Not everyone is convinced.

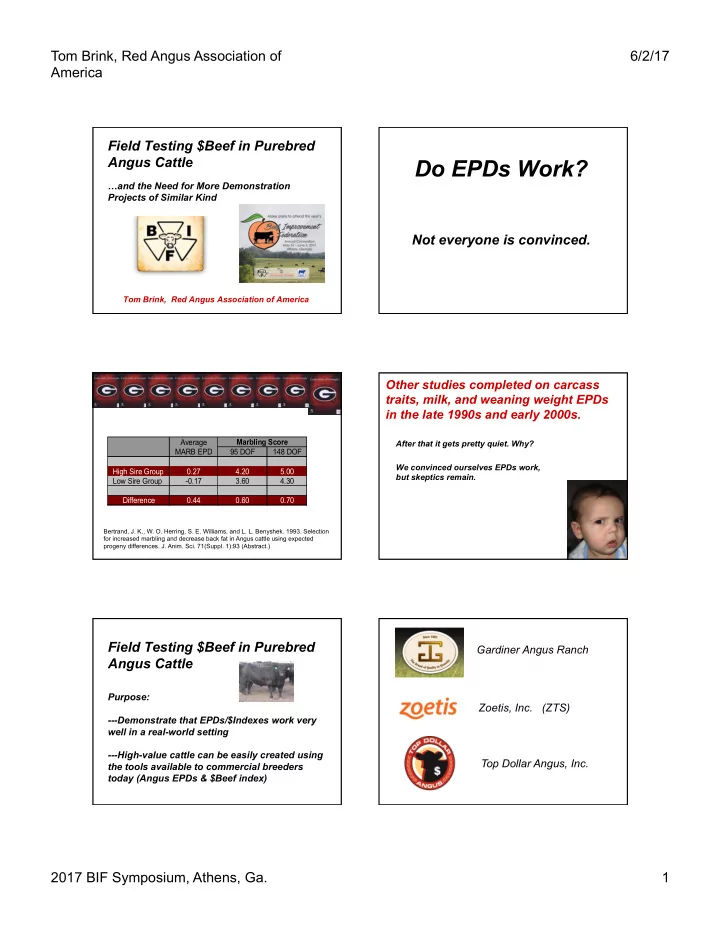
Bertrand, J. K., W. O. Herring, S. E. Williams, and L. L. Benyshek. 1993. Selection for increased marbling and decrease back fat in Angus cattle using expected progeny differences. J. Anim. Sci. 71(Suppl. 1):93 (Abstract.)

Average Marbling Score MARB EPD 95 DOF 148 DOF High Sire Group 0.27 4.20 5.00 Low Sire Group

  • 0.17

3.60 4.30 Difference 0.44 0.60 0.70

Other studies completed on carcass traits, milk, and weaning weight EPDs in the late 1990s and early 2000s.

After that it gets pretty quiet. Why? We convinced ourselves EPDs work, but skeptics remain.

Field Testing $Beef in Purebred Angus Cattle

Purpose:

  • --Demonstrate that EPDs/$Indexes work very

well in a real-world setting

  • --High-value cattle can be easily created using

the tools available to commercial breeders today (Angus EPDs & $Beef index)

Gardiner Angus Ranch Zoetis, Inc. (ZTS) Top Dollar Angus, Inc.

slide-2
SLIDE 2

Tom Brink, Red Angus Association of America 6/2/17 2017 BIF Symposium, Athens, Ga. 2 Field Testing $Beef in Purebred Angus Cattle

Methods:

  • --High $B and Low $B purebred Angus embryos

implanted in recipient dams in July 2014.

  • --Calves born April 8 to May 22, 2015.
  • --Calves on pasture with dams through weaning, then

placed on wheat pasture and supplemented with a grower ration until early June.

Field Testing $Beef in Purebred Angus Cattle

Methods (continued):

  • --Cattle placed on feed on June 4, 2016 and DNA

samples collected.

  • --Targeted equal fat endpoint and therefore marketed in

three drafts from late September to early November 2016.

  • --All 43 head harvested at National Beef in Dodge City,

KS and priced via USPB grid.

Results

High $B cattle outperformed their Low $B counterparts in every metric evaluated by the study. Pedigree average $B difference was $93.69 between the two groups ($141.12 versus $47.40). The study evaluated the animals themselves (not their progeny), so the expected value difference between the High $B and Low $B groups is twice their pedigree average $B difference or $187.38 per head ($93.69 x 2 = $187.38, which is the $B difference expressed in breeding value terms).

$BEEF Comparison: $141.12 vs. $47.40

Actual difference quantified by the study = $215.47 per head

High $Beef Advantage Statistically Trait or Characteristic versus Low $Beef Different Parental Average $Beef $93.69 Yes $Beef Difference as a Breeding Value $187.38 Yes Zoetis i50K Percentile Rank Difference* (average of YW, CW, MARB, & REA) 75.2% Yes GeneMax Feeder Advantage Score 67 points Yes Lifetime Weight Per Day of Age 0.158 lbs. Yes Age at Harvest

  • 15.9 days

Yes Carcass Weight (non age constant) 27 lbs. Yes Carcass Weight (age-constant basis) 56 lbs. Yes

slide-3
SLIDE 3

Tom Brink, Red Angus Association of America 6/2/17 2017 BIF Symposium, Athens, Ga. 3

High $Beef Advantage Statistically Trait or Characteristic versus Low $Beef Different Parental Average $Beef $93.69 Yes $Beef Difference as a Breeding Value $187.38 Yes Zoetis i50K Percentile Rank Difference* (average of YW, CW, MARB, & REA) 75.2% Yes GeneMax Feeder Advantage Score 67 points Yes Lifetime Weight Per Day of Age 0.158 lbs. Yes Age at Harvest

  • 15.9 days

Yes Carcass Weight (non age constant) 27 lbs. Yes Carcass Weight (age-constant basis) 56 lbs. Yes High $Beef Advantage Statistically Trait or Characteristic versus Low $Beef Different Marbling Score (MS units) 227 Yes Ribeye Area 1.41 sq. inches Yes Back fat

  • 0.05 inches

No Calculated Yield Grade

  • 0.46 YG Units

Yes Carcass Value Per Head $166.82 Yes Feed & Yardage Savings Per Head $48.65 Yes Total Financial Advantage Per Head $215.47 Yes High $Beef Advantage Statistically Trait or Characteristic versus Low $Beef Different Marbling Score (MS units) 227 Yes Ribeye Area 1.41 sq. inches Yes Back fat

  • 0.05 inches

No Calculated Yield Grade

  • 0.46 YG Units

Yes Carcass Value Per Head $166.82 Yes Feed & Yardage Savings Per Head $48.65 Yes Total Financial Advantage Per Head $215.47 Yes

High $Beef Genetics =

Low $B Heifer

Low Choice YG2 870-lb. Carcass

slide-4
SLIDE 4

Tom Brink, Red Angus Association of America 6/2/17 2017 BIF Symposium, Athens, Ga. 4 High $B Heifer

Prime YG2 887-lb. Carcass

Predicted Difference = $187.38 Measured Difference = $215.47

The measured difference is conservative, because it included no feed efficiency advantage for the High $Beef group.

$Beef worked extremely well in projecting real-world value differences in purebred Angus cattle. Results suggest that (if anything) the EPDs and mathematical calculations that drive $Beef are conservative compared to current cattle market valuations.

Takeaway from the study is simple:

Use EPDs and indexes, because they work very well in creating real-world performance and financial advantages.

  • ---Write-up is available---

Next Project in Queue…

  • Red Angus “EPDs in Action”
  • Conducted with JRA
  • Project entitled Live WiRED
  • Direct comparison of Red Angus sires with high

growth/carcass EPDs to those low on the bell curve for growth and carcass traits.

50 Red Angus sired pregnancies

  • ut of ONE cow!
slide-5
SLIDE 5

Tom Brink, Red Angus Association of America 6/2/17 2017 BIF Symposium, Athens, Ga. 5

Conclusion

  • More simple studies validating EPDs are needed

to convince the skeptics and the coming generation of cowherd managers

  • Breed association databases represent a large

aggregation of field data that can be used for this purpose as well

  • Incorporate the ability to compare differing levels
  • f EPDs into other research for dual benefit

Today’s winding down, but tomorrow could be a really big day.

Thanks!