
SLIDE 1
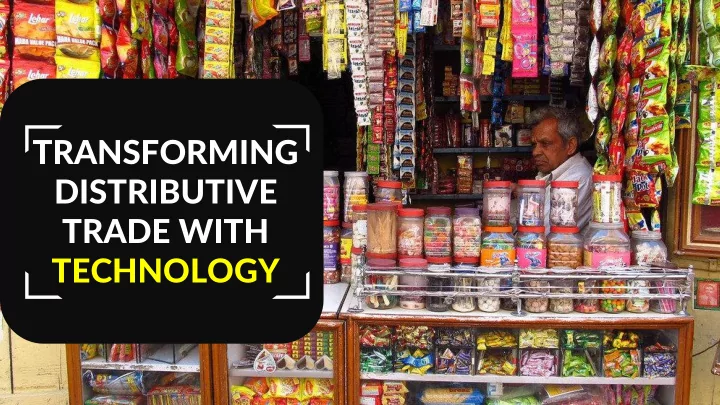
TRANSFORMING DISTRIBUTIVE TRADE WITH TECHNOLOGY
DISTRIBUTIVE TRADE WITH TECHNOLOGY 2 INDIA CD LANDSCAPE 3K+ - - PowerPoint PPT Presentation
TRANSFORMING DISTRIBUTIVE TRADE WITH TECHNOLOGY 2 INDIA CD LANDSCAPE 3K+ 19k+ 30k+ 5000+ 4000+ Sales Logistics Beauty Distributors Merchandisers Representatives Manpower Advisors 3 140 Mn 90k+ 600k Sq. Ft Units Sold per Day
TRANSFORMING DISTRIBUTIVE TRADE WITH TECHNOLOGY
2
INDIA CD LANDSCAPE
3K+
Distributors 4000+ Merchandisers
19k+
Sales Representatives
30k+
Logistics Manpower 5000+ Beauty Advisors
3
Shakti Entrepreneurs
WIDEST RURAL REACH
600k Sq. Ft
BIGGEST IN STORE MERCHANDIZING
140 Mn
Units Sold per Day
3 Units sold to every Indian Citizen monthly
1.6x 1.3x 1.05x 1x
Many brands reach over million outlets
4
E-COMMERCE MODERN TRADE
MARKET SHARE GROSS MARGIN
GENERAL TRADE
5
Image Image
DEMAND CAPTURE DEMAND FULFILMENT DEMAND GENERATION cover the right outlets at the right frequency with the right assortment speedy delivery of
most optimal cost world class in store execution & shopper loyalty to win at the point of purchase
Pilla illars of CD Strategy
6
DEMAND CAPTURE
7
Increase Direct Reach Distribution
More Stores More Assortment Democratize Ordering
8
Adding Adding Sto Stores res – followin following g the the sustainable sustainable rhythm rhythm
Scouting Salesman Addition OL Addition Service Mix Upgrade GPS Fixing Month 1 Month 2 Month 3-5 Month 9-12 Month 6-9
Building a Rhythm of outlet addition
Strea Streamli mlining ning the the pro proce cess ss of o f outlet utlet addi additi tion n – ma maki king ng it it re repea peatable, table, scalabl scalable e & & eff effici icien ent
9
Increase Direct Reach Distribution
More Stores More Assortment Democratize Ordering
10 10
Better Replenishment Better Replenishment is o is our b ur bigg iggest l est lever ever to to grow grow ass assortment
Assortment is not just about the sale of new packs but also their subsequent
replenishment
30% 15% 11% 8% 7% 6% 5% 5% 4% 3% 3% 2% 1x 2x 3x 4x 5x 6x 7x 8x 9x 10x 11x 12x % Contribution Frequency of Replenishment
Spread of Replenishment Across our Universe
11 11
Lev Leveraging eraging Baye Bayesian sian networks networks for im for impro proved ved replenis replenishment hment modelling modelling
A probabilistic model which learns outlet and pack behavior trends to provide more relevant tasks to the Salesman in the given month
Pack Type Outlet Type Purchase Frequency Purchase Quantity Will the line sell this Month?
12 12
Simpl Simplified ified KPIs KPIs
Easy to Sell Easy to Earn
Set of packs an outlet regularly buys Set of incremental packs which have a priority
Total Lines Sold Per Day
Total Assortment
Simpl Simplified ified Interface Interface
13 13
Increase Direct Reach Distribution
More Stores More Assortment Democratize Ordering
14 14
Democ Democratize ratize order
taking from S from Salesman alesman : : B2B App B2B App
Customized Promotions
4 Cities Q1’ 18 8 Cities Q2’ 18 13 Cities Q3’ 18
RAPID SCALE UP
Business Transparency Any time
15 15
DEMAND FULFILLMENT
16 16
automation
Delivery Transparency Automation
17 17
Faster Faster & o & on-time time deliveries deliveries key key for g for growt rowth
Delivery Optimization is key to improve last mile efficiency
Higher the delay in delivery Larger is the Cost of Delay Lesser is the Productivity
39% 52% 54% 8% n+2 delivery % D+F Key Retail PRS Kiosk
5% 10% 18% n+2 n+3 n+4
% return as per delivery date
90% 88% 81% N+2 N+3 > N+3
Probability of billing in next salesman visit
Mass Retail Key Retail Chemists Kiosks
N+2 Delivery %age Return as per delivery date
18 18
automation
Delivery Transparency Automation
19 19
Handl Handling ing Comp Complexity lexity thro throug ugh Ro h Robo botizatio tization
20 20
DEMAND GENERATION
21 21
Program Stores
Wire Up Stores Direct to Consumer
22 22
Partnerships Partnerships to to wire up wire up & win & win at scale at scale
Billing Solution Shopper Retargeting Loyalty Program Cashless Payments
23 23
Program Stores
Wire Up Stores Direct to Consumer
24 24
B2B2C : B2B2C : Humarashop Humarashop – The The power power of
Hyperlocal
25 25
B2B2C : B2B2C : Humarashop Humarashop – The The power power of
Hyperlocal
SHOPPER RETAILER IT PLATFORM
MASTERS ORDER DELIVERY SHOP & PROMOTER UPDATES PRICES SHOPPER SEES REAL TIME SHOPPER PLACES ORDER RETAILER GETS NOTIFIED RETAILER CLICKS DISPATCH DELIVERY PARTNER/STORE PICKUP PARTNER DELIVERS
26 26
Image Image
DEMAND CAPTURE DEMAND FULFILMENT DEMAND GENERATION
CD Strategy : : Summary ry
More Stores More Assortment Democratize Ordering Delivery Transparency Automation Wire up Stores Direct to Consumer