SLIDE 1 1
Distributional Effects of Irrigation Water Price Changes, a Case Study in Lake Urmia Basin
Farah Asna Ashari Ruhr University Bochum – Germany Iran is located in the mid-latitude belt of arid and semi-arid regions of the earth with limited availability of water resources which has confronted the state with water management
- challenges. Water scarcity across the country has growing influence on development plans in
several sectors which rely on water resources. The country has 0.36 percent of the world’s freshwater resources while about 1 percent of the world’s population live there (IWRMC, 2005). Annual rainfall in Iran varies from 50 mm in central Kavir Desert to 2275 mm in Caspian Sea basin with an overall annual average rainfall of 228 mm which almost 66 percent of the rainfall evaporates. Agricultural activities are a significant contributor to the economy of Iran. In the interest of attaining food security and self-sufficiency, and being prepared to mitigate the impact of international sanctions against Iran, agricultural development plans have always been paid special attention by government. However, the environmental and socio-economic rationales for these plans are questioned. Nearly one-third of the total area of Iran is appropriate for agricultural activities (FAOSTAT, 2012) and the estimation of 16.3% of labor force is engaged with agricultural sector (The World Factbook, 2013). Agriculture accounts for an average of 11% of the GDP (Iran Economy Stats, 2012) Almost all arable (99 percent) in Iran is run and managed by private sector. More than 90 percent of rural agricultural households possess lands with small and medium farm size. Farming activities is determined by adequate water accessibility which is mostly scattered in different regions of the county (Keshavarz, Ashraft, Hydari, Pouran, & Farzaneh, 2005, p. 156) and living condition of rural population is strongly affected by water resources. Agricultural sector consumes 92 percent of the 93.3 Billion Cubic Meters (BCM) water use. Groundwater is main source of water in agriculture; Legal as well as illegal groundwater abstraction covers about 70 percent of water use in agriculture levels (Hashemi M., 2012, pp. 88-89). The 1982 Fair Water Distribution (FWD) Act states that water as a common pool
SLIDE 2 2 property belongs to the state. Private well owners own much of the groundwater which is controlled by issuing water allocation permits, although there are illegal and informal abstractions which cannot be controlled. Surface water is mostly abstracted through traditional water rights. Iran is the 5th country in the world in terms of irrigated land area (Hashemi M., 2012, p. 91).
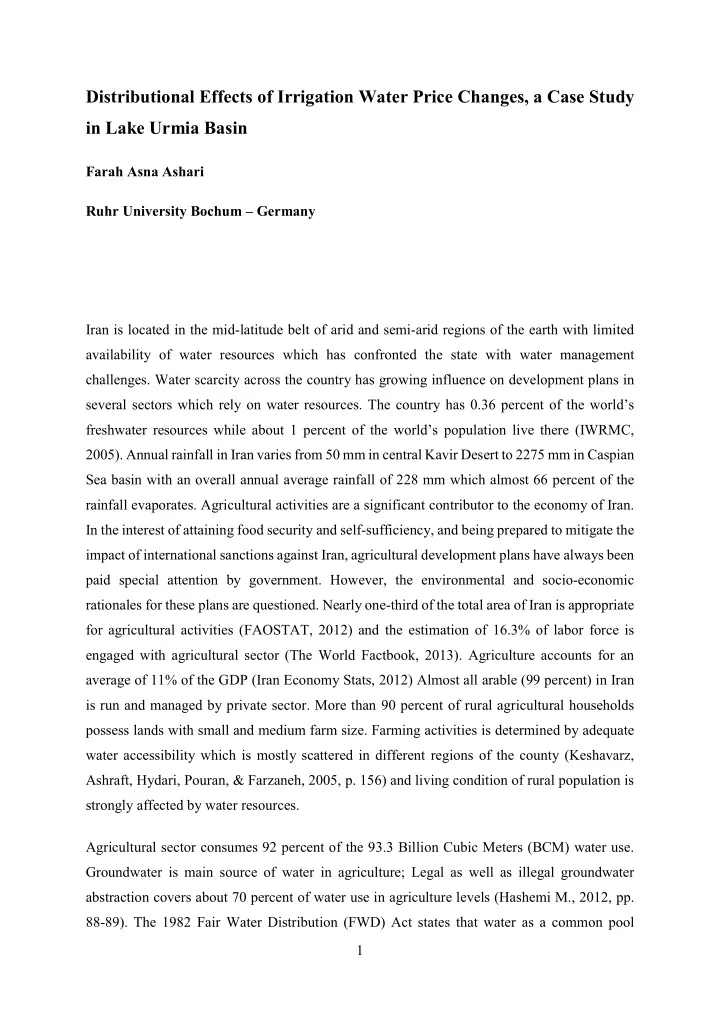
Figure 1- Lake Urmia Basin Location in Iran
Source: https://aquapedia.waterdiplomacy.org/wiki/index.php?title=File:Urmia2.jpg 1
The dominant economic activities in the basin is mainly agricultural followed by industrial and
- tourism. Agriculture is cited as the principal user of raw water in the basin with 75 percent of
water use in the lake basin which is supplied through surface and groundwater sources. Urban supply is accounted for of 21 percent of the water consumption in the area followed by industry with 4 percent (mostly textile industry). Figure 2 illustrates the water consumption per sector.
1 Ecological zone is the entire Lake plus surrounding wetlands and other habitats which have a strong ecological connectivity
with the Lake.
SLIDE 3
3
Figure 2. Water Consumption by Sector in Lake Urmia Basin
Source: (Yekom, 2002)
The lake has been subject to extensive draining resulting to a critical condition of declining water level and increasing salinity for the last decades. The extensive demand for water due to increasing population and agricultural activities resulted depriving the lake of replenishment water and lessening the quality and quantity of the water in the lake. Most of the wetland derived goods and services have been lost in recent years threatening the globally important biodiversity provided by the lake and the basin ecosystem. The lake water level dropped to 1270.42 meters in 2013 which is 3.5 meters under the ecological sustainable level and the lake area has reduced by 46% to 2700 Km2 (Jabbari, 2011). A growing attention to the deteriorating environmental condition of the lake has started since 1990s. The surface area of the lake is being declining. Since 1995 the lake area has shrunk to less than half of its size with falling water levels (Hashemi M., 2012, p. 124 and 150). . Since the lake Urmia basin has about 7 percent of Iran water resources, Iranian policymakers, particularly the Ministry of Energy (MoE) had a growing attention to the Lake in the last decades and it has been registered on the political agenda since 2000. As already mentioned irrigation is capturing the major share of water resources in Lake Urmia basin. Demand for water has increased in response to agricultural development plans. Surface water inflows to the Lake have been diverted to irrigation schemes and underground water resources have been overexploited to meet agricultural demand that has imposed some significant pressures on the lake’s ecosystem. The opportunity costs associated with diverting the water away from the lake has not been realized and incorporated into the development plan for the region. An important challenge in the area is maintaining the natural ecosystem of the lake basin to provide essential support to life for human and all species in the region. Irrigation water pricing
Agricultural 75% Urban 21% Industry 4%
SLIDE 4
4 is a sensitive policy intervention as farmers rely on their farm income for their basic needs. As an objective in this research we estimate the distributional effect of irrigation water price changes on farm households. However, the data limitation does not allow for more detailed analysis, this analysis still give us a good indication of welfare loss distribution. The data used here is a cross sectional data collected from a sample selected in a multi-stage sampling of farm households in Lake Urmia basin in 2013. Some 273 farm households randomly were sampled from two districts (Shabestar, Ajabshir) including 9 villages in the area. Quantile Regression First we implement a quantile regression to find the coefficient of independent variables for poorest to richest group. Then percentage of farm revenue, and percentage of welfare loss are determined for five groups under a hypothetical water pricing scenario in order to explore the effect of price changes on each group. This section will be closed with Lorenz curve for farm income before and after the water price changes. The dependent variable of the study is divided in three groups; low, medium and high income (0.25, 0.50, 0.75 quantiles). The last regression is the regression for the 0.1 quantile or the whole data for the dependent variable. Table 1 presents the results for quantile regression. These results indicate the effect of independent variables along the distribution of dependent variable. In all three quantile regressions labor and intermediate inputs coefficients, and land in quantile 0.75 are not significantly different from zero. The other variable coefficients for all quantiles are significantly different from zero at 95% or 90% level. The figure 3 shows a method to visualize the change in quantile coefficients along with confidence intervals. In each plot, the regression coefficient at a given quantile indicates the effect on farm income of one percent change in that variable, assuming that the other variables are fixed. Green lines are the slope coefficient for the quantile of the x axis and the gray shadows around it are the confidence intervals for that specific variables. The dashed lines are the least squares estimate and the dotted lines are its confidence interval at 95% level. The quantile slope estimates are not statistically different from the least squares estimate. The OLS
SLIDE 5 5 coefficients for intercept, land, and water are significantly far away from zero (the confidence intervals are above 0 in y axis). The confidence intervals for intermediate inputs and labor (as this graphs are at 95% level) include zero which means the coefficient for these two variables are not significantly different zero. These graphs confirm the table results that the linear regression slope is sufficient to describe the relationship between dependent and independent
- variables. The quantile coefficients do not considerably differ from the OLS regression.
Table 1. Estimation of the Sample Households’ Farm Income via OLS and Quantile Method
Independent Variables OLS Q(0.25) Q(0.50) Q(0.75) Constant 9.82562* 10.52381* 10.23812* 11.07453* 0.000 0.000 0.000 0.000 Labor 0.1298438**
0.092567 0.1580085 0.100 0.882 0.237 0.257 Land 0.3243378* 0.5080068* 0.279651* 0.2203332 0.000 0.000 0.000 0.112 Intermediate Inputs 0.0102911 0.0106062 0.0126759
0.588 0.639 0.501 0.984 Water 0.504834* 0.4795979* 0.4811069* 0.4183061* 0.000 0.000 0.000 0.000
251
Dependent Variable: Farm income * significant at 95% level ** significant at 90% level + significantly different quantile regression coefficient from OLS at 5% significant level
Source: Own field research data
Farm Income as a Wealth Proxy The distributional effect of introducing alternative water prices is investigated by using farm income as a wealth index. Quantile 1 corresponds to the 20 percent of the population having the lowest farm income, quantile 5 corresponds to the 20 percent of the population having the highest farm income. The ratio of the highest to the lowest quantiles for farm income is 12.5. This ratio for share of welfare loss is 10. The ration results indicate that inequality in welfare lose is bigger than farm income.
SLIDE 6 6
Figure 3. Graphical representation of the quantile regression estimates
Source: Own field research data
Table 2. Distribution of Effects of Changes in Irrigation Water Prices by Farm Income Quantiles Lowest land size to highest Shares of Farm Income Share of welfare loss First quantile (Poorest) 4.1 4.7 Second quantile 10.0 11.3 Third quantile 14.4 15.2 Forth quantile 20.5 21.8 Fifth quantile (Richest) 51.1 47.0 Total 100 100 Ratio of the highest to the lowest 12.5 10
Source: Own field research data
0.00 5.00 10.00 15.00 20.00 Intercept .2 .4 .6 .8 1 Quantile
0.00 0.50 1.00 ManDays .2 .4 .6 .8 1 Quantile
0.00 0.50 1.00 1.50 Land .2 .4 .6 .8 1 Quantile
0.05 0.10 0.15 IntermediateInputs .2 .4 .6 .8 1 Quantile
0.00 0.50 1.00 TotalWater .2 .4 .6 .8 1 Quantile
SLIDE 7 7 Lorenz Curve and Gini Index Lorenz curve is a visualized tool to show the income distribution in economics. In this study it is used to illustrate the farm income distribution after and before water price changing. The closer the curve to the equality line, more evenly income distribution is. As the water price changes are proportional (50,75,100 percent) we only draw one of the curves after water price
- change. The black solid line is the curve before price changing and the dotted line is after
changing the irrigation water price changes. The Lorenz curve graph (Figure 4) confirms the previous findings that water price changes do not have a significant effect on income
- distribution. The curve before and after water price change are almost the same, though after
water price changes the farm income line lies slightly outside the one before change and indicates a small increase in inequality in income distribution.
Figure 4. Lorenz Curve for Wealth Distribution Before and After Water Price Changes
Source: Own field research data
As a tool for income distribution within the sample, a Gini income inequality index discussed in Tsur and Dinar (1995, p. 24) is adjusted and calculated.
10 20 30 40 50 60 70 80 90 100 20 40 60 80 100
Cummulative Farm Income Cummulative Population
Farm income Farm income after increaseing water price Equality
SLIDE 8 8
𝐇 = 𝟐 + 𝟐 𝐨 − 𝟑 𝐨𝟑𝛎 (𝐨 − 𝐣 + 𝟐) 𝛒𝐣
𝐨 𝐣𝟐
(𝟓. 𝟔)
where 𝜌 represents profits for farm household i ( introduced in 2.4), n is the number of farm households, and 𝜈 is the mean farm households profits (𝜈 =
𝛒𝐣
𝐨 𝐣𝟐
) the Gini index is calculated under the original as well as the three hypothetical water pricing
- schemes. The Gini index equal to zero means all sample members have equal share of the
income while a Gini index equal to 1 means one member of the sample gets all the income and the rest earn nothing. The Gini indexes calculated for before and after water price changes in this study are 0.25, 0.26, 0.27, and 0.27. The results show little effects of changing water prices effect on Gini index, which means this will have a small effect on income distribution in the studied sample. This finding is in line with Tsur and Dinar’s (1995) and (2004) results concluding that irrigation water pricing has little effect on income distribution. However Huang et al. (2006) in their study about irrigation water pricing policy in rural China conclude that doubling irrigation cost increases the Gini coefficient of households income to 9.8 percent and increases the inequality. Irrigation water pricing is a sensitive policy intervention as farmers rely on their farm income for their basic needs. In equity consideration of the studied sample it is observed that poor farm households who belong to the lower quantiles burden more from water price increase in comparison to rich farmers with more farm income, but these differences are not significantly
- high. Therefore, the before and after price changes the welfare distribution is almost the same.
The findings from Gini index and Lorenz curve reveals that changing irrigation water prices have rather negligible effects on farm income distribution and cannot be considered as an equity tool.