
SLIDE 1
http://upload.wikimedia.org/wikipedia/commons/5/58/USA_North_Carolina_relief_map_cut.jpg
- Dr. Amy Knisley
North Carolina: An Environmental Overview Leadership North Carolina - - PowerPoint PPT Presentation
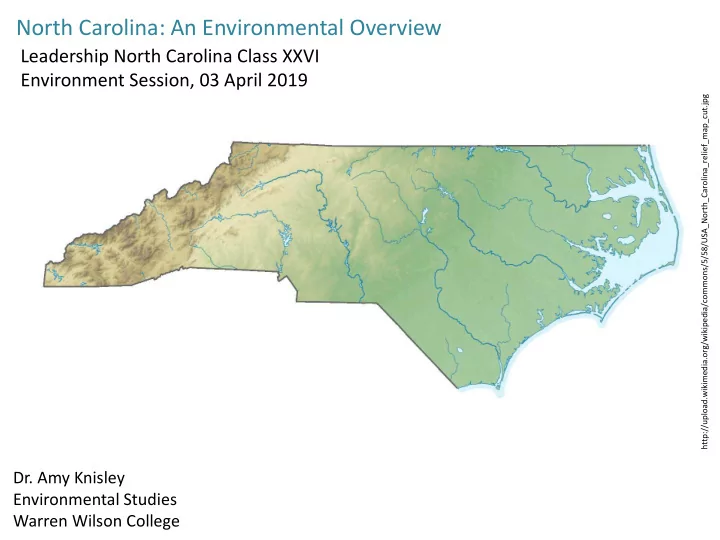
North Carolina: An Environmental Overview Leadership North Carolina Class XXVI Environment Session, 03 April 2019 http://upload.wikimedia.org/wikipedia/commons/5/58/USA_North_Carolina_relief_map_cut.jpg Dr. Amy Knisley Environmental Studies
http://upload.wikimedia.org/wikipedia/commons/5/58/USA_North_Carolina_relief_map_cut.jpg
~500 miles E to W 53,821 miles2 90.5% land, 9.5% water 28th in land area
River Miles: RI 1400 SC 29,900 NC 37,800 AK 365,000 VA 49,300 Persons/square mile in 2015: 1-NJ (1218) 14-VA (212) 15-NC (207) 50-AK (1.3) 19-SC (163) 0’
301 miles of coastline (=VA + SC) 7th of 23 coastal states (TX=6th, OR=8th) 6% of U.S. shoreline (excl. AK)
http://upload.wikimedia.org/wikipedia/commons/5/58/USA_North_Carolina_relief_map_cut.jpg https://en.wikipedia.org/wiki/List_of_U.S._states_by_coastline
Albermarle Snd Pamlico Snd
Chowan Tar-Pamlico Roanoke Neuse Cape Fear Pee Dee Catawba Broad French Broad Pigeon
Tuckaseegee Little Tenn. Nantahala
Yadkin Dan
River Miles: RI 1400 SC 29,900 NC 37,800 AK 365,000 VA 49,300
http://upload.wikimedia.org/wikipedia/commons/5/58/USA_North_Carolina_relief_map_cut.jpg
U.S. Census Bureau
U.S. Bureau of Economic Analysis, 2018
ND=$49b (47th) NC=$484b (11th) VA=$464b (13th) SC=$199b (26th)
U.S. Bureau of Economic Analysis, 2018
ND=$55,360 (4th) NC=$45,216 (34th) VA=$50,180 (18th) SC=$42,958 (44th)
NC DENR, State of the Environment Report 2011, p58
U.S. Department of Agriculture. 2018. Summary Report: 2015 National Resources Inventory.
Excludes Alaska
National Wetlands Inventory, U.S. Fish and Wildlife Service (2017)
US Fish and Wildlife Service
Brad Rich, “A Disturbing Report about Wetlands” (Dec 2013)
USFS Forest Inventory and Analysis (2012), https://www.fia.fs.fed.us/
“Baseline Estimates of Carbon Stocks in Forests and Harvested Wood Products for National Forest System Units; Southern Region.” USDA Forest Service (2015) http://www.fs.fed.us/climatechange/documents/SouthernRegionCarbonAssessmentTwoBaselines.pd
One Tg (teragram) = 1 trillion grams! 1 paperclip = 1 gram! Great Pyramid of Giza = 6 Tg.
AL, KY, GA, TN, FL, LA, MS, VA, AR, OK, NC, SC, TX, P.R. 4 Natl For units, 2 special units
USGS Protected Areas Data Portal (2017): https://gapanalysis.usgs.gov/padus/data/statistics/ USGS Protected Areas Database/Viewer: https://maps.usgs.gov/padus/
U.S. Census Bureau Building Permits Survey (2016)
Pork Checkoff. State Rankings by Hog and Pig Inventory. https://www.pork.org/facts/stats/structure-and-productivity/state-rankings-by-hogs- and-pigs-inventory/
NC DEQ, North Carolina Conservation Planning tool (2013)
EPA National Overview: Fact and Figures
NC DEQ, Div of Waste Management. Legislative Reports (2017)
NC DEQ, Div of Waste Management. Legislative Reports (2017)
NC DEQ. Div of Waste Management Legislative Report (2017).
NC DENR, State of the Environment Report 2011, p58
NC Dept of Envt and Nat Resources, North Carolina State of the Environment Report 2011, p23
Steady NAAQS improvement Localized noncompliance Hazardous air pollutants
187 Federally-listed: Metals, such as cadmium, mercury, chromium, and lead compounds. Solvents, such as trichloroethylene, hexane, and methylene chloride. Others, such as benzene, dioxin, asbestos, and toluene. NC has added 21, including acetic, nitric and sulfuric acids; ammonia; bromine.
https://deq.nc.gov/about/divisions/air-quality/air-quality-monitoring
NC DENR State of the Environment Report 2011, p25 NC DENR, State of the Environment Report 2011, p28
Map 1: NC Current Nonattainment and Maintenance Areas
NC DENR, State of the Environment Report 2011, p32
2011 National Air Toxics Assessment – evaluates 138 air toxics for which EPA has health benchmarks; estimates “excess” cancer and non-cancer health risks attributable to them. In each census tract, maximum exposure is assumed over a 70 year lifetime.
NC Dept of Envt and Nat Resources, North Carolina State of the Environment Report 2011, p23
Steady NAAQS improvement Localized noncompliance Hazardous air pollutants
NC DENR, State of the Environment Report 2011, p33
NC DENR, State of the Environment Report 2011, p42
NC DENR, State of the Environment Report 2011, p35
Duke Power Asheville Plant NPDES permit (2006) re “Outfall 001” (Ash Pond Treatment System)
~500 farm owners ~4400 lagoons ~16.7 million swine
NC DENR, State of the Environment Report 2011, pp36-37
1970s 1980s
NC DENR, State of the Environment Report 2011, p38
NC DENR, State of the Environment Report 2011, p41
Southern Environmental Law Center (2016)
NC Dept of Envt and Nat Resources, North Carolina State of the Environment Report 2011, p49
NC DENR Div of Marine Fisheries coastal water quality sampling, interactive map: http://portal.ncdenr.org/web/mf/testing-sites NC DENR, State of the Environment Report 2011, p52
NC DENR, State of the Environment Report 2011, p33
by SOURCE TOTAL
by SOURCE TOTAL
by SOURCE TOTAL
U.S. EIA (2018)
WY 860 (2) RI176 (51) SC 333 (18) NC 251 (37) VA 277 (31) CA 199 (48)
WY 112.3 (1) NY 8.6 (50) SC 15.5 (28) NC 12.8 (34) VA 12.5 (38) CA 9.2 (49)
by SOURCE TOTAL
VA 6.7% (33d) NC 7.9% (28th) SC 9.0% (25th)
US EIA, State Reports (2015)
CA 11.5% (16th) LA 3.7% (46th)
American Council for an Energy Efficient Economy. State Policy Scorecard program. State Government: Financial incentives e.g. tax credits for energy efficient homes/renovations; credits for renewable energy production; zoning incentivizing wind and solar; state fleet efficiency. Building: Building efficiency codes and compliance with them. Combined Heat and Power: Policies and financial incentives that encourage CHP at multiple scales. Utilities: Policies requiring utilities to make the energy mix green and efficient; financial incentives to support this; disclosure rules for utilities and public access to information; strong compliance. Transportation: Tailpipe emissions rules and compliance; mass transit funding and provision. Appliance Standards: Efficiency standards and compliance, from microwaves to furnaces.
2018 Scorecard, American Council for an Energy Efficient Economy
N.C. Coastal Resources Commission Science Panel on Coastal Hazards, North Carolina Sea Level Rise Assessment Report (2010), p11 (under auspice of NCDENR Div of Coastal Management
Environmental Studies Warren Wilson College aknisley@warren-wilson.edu
NC Agricultural Development and Farmland Preservation Trust (2013)
NC DEQ, Pre-Regulatory Landfills map (2016)
NC DEQ , Inactive Hazardous Sites Report to the Legislature (2016).
NC DEQ , Inactive Haz Waste Sites Map (2016)
NC DEQ , Inactive Hazardous Sites Report to the Legislature (2016).