
SLIDE 1
Discovery and analysis of biochemical subnetwork hierarchies - - PowerPoint PPT Presentation
Discovery and analysis of biochemical subnetwork hierarchies October 6, 2003 Petter Holme Department of Physics, Ume a University, Ume a, Sweden NORDITA, Copenhagen, Denmark Mikael Huss SANS, NADA, Royal Institute of Technology,
http://www.tp.umu.se/∼holme/ 1 Ume˚ a University, Sweden
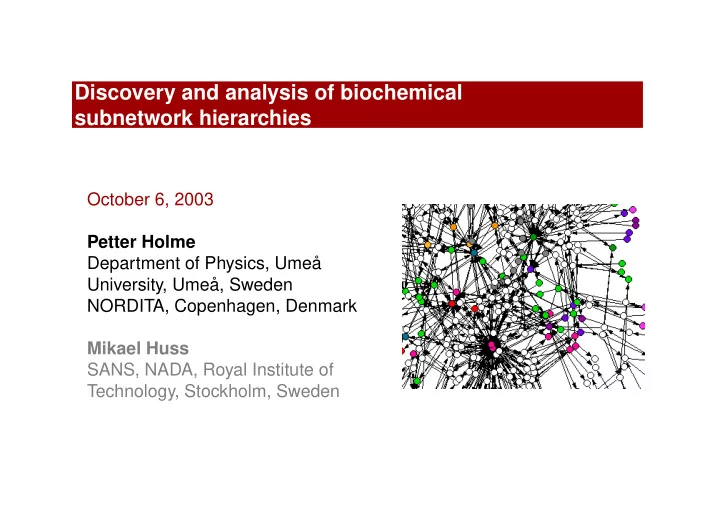
metabolic pathways of Borrelia burgdorferi (a bacterium)
http://www.tp.umu.se/∼holme/ 2 Ume˚ a University, Sweden
Complexity Even E. coli has a metabolism involving
The coarsest level of description—the graph representation—is needed, at least as a complement. One would like to decompose the graph into functional subunits. Both for con- ceptual and analytical purposes. Our work Earlier algorithms have been based on local algorithms that may miss some large- scale features. Not much known about how the large scale subnetwork ordering looks like. Can the network easily be decomposed into autonomous subnetworks? How inde- pendent are the modules? Is it useful to talk about modules at all? The basic assumption If we find a subnetwork that is well-connected within, and sparsely connected to the out- side, then it is likely to be a relatively au- tonomously functioning subnetwork.
http://www.tp.umu.se/∼holme/ 3 Ume˚ a University, Sweden
The reaction A + B ↔ C + D in a directed bipartite representation: Two types of vertices, representing substrates and chemical reactions. Arcs (arrows) between different types of vertices We denote the set of chemical substances by S and the set of reaction vertices by R.
http://www.tp.umu.se/∼holme/ 4 Ume˚ a University, Sweden
Based on: M. Girvan & M. Newman, PNAS 99 (2002), pp. 7821-7826. Presented in: P. Holme, M. Huss, and H. Jeong, Bioinformatics 19 (2003), pp. 532-538. The idea Recursively delete reactions situated between densely connected regions.
tweenness cB(r) for all reac- tion vertices.
tex with highest effective betweenness and all its in- and out-going links.
current state of the net- work.
http://www.tp.umu.se/∼holme/ 5 Ume˚ a University, Sweden
(continued)
Let CB be the betweenness of r with respect to the substance-vertices. CB(r) = ∑
s∈S ∑ s′∈S\{s}
(1) where σss′(r) is the number of shortest paths between s and s′ that passes through r, and
The reactions we delete recursively are the one having the highest effective betweenness: cB(r) = CB(r)/kin(r) (2) where kin(r) is the in-degree (# of substrates) of the reaction r. This rescaling is sensible since all substrates needs to be present for a reaction to occur.
http://www.tp.umu.se/∼holme/ 6 Ume˚ a University, Sweden
The substrates are at the base of the tree. If a horizontal line is drawn across the tree, the vertices below are connected at that particular level of the hierarchy. Clusters that are isolated high in the hierarchy (close to the bottom of the tree) are more entangled in other pathways.
http://www.tp.umu.se/∼holme/ 7 Ume˚ a University, Sweden
(continued)
(a) Clusters that get isolated at the same level are more highly wired within, than to its surrounding (and therefore a candidate to a functional module). (b) Vertices that becomes isolated at the same level forms an outer shell of the cluster in question.
http://www.tp.umu.se/∼holme/ 8 Ume˚ a University, Sweden
http://www.tp.umu.se/∼holme/ 9 Ume˚ a University, Sweden
We test 43 organ- isms of the WIT database. S1 size
the biggest cluster. S2 size of the sec-
h h h , , S2 S1/ S2 S1 ~ ~ , , S2 S1/ S2 S1 ~ ~ , , S2 S1/ S2 S1 ~ ~ , , S2 S1/ S2 S1 ~ ~ h h h
0.2 0.4 0.6 0.8 1 0.2 0.4 0.6 0.8 1 0.2 0.4 0.6 0.8 0.2 0.4 0.6 0.8
metabolic network whole cellular network
20 40 60 50 100 150 200 250 20 40 60 80 10 20 30 80 120 160 10 20 30 40 40 50
S1 ~
2
~ S S1/ S2
http://www.tp.umu.se/∼holme/ 10 Ume˚ a University, Sweden
(continued)
max
Synechocystis sp.
max
max
max
max
max
0.1 0.2 0.3 0.4 0.5 0.6 0.7 0.8 0.9 1 0.05 0.1 0.15 0.2
1 max
1 max
1 max
http://www.tp.umu.se/∼holme/ 11 Ume˚ a University, Sweden
If, during the iterations of the GN algorithm, an isolated vertex set S′ ⊂ S fulfills the following criterion it is said to be a weak community if:
s∈S′
Kin(s) > ∑
s∈S′
Kout(s) , (3) and a strong community if: Kin(s) > Kout(s) for all s ∈ S′ , (4) where Kin(s) is the number of s ∈ S that are products of a reaction involving a substrate s ∈ S, and Kout(s) is the number of s ∈ S \ S′ that are products of a reaction involving a substrate s ∈ S.
http://www.tp.umu.se/∼holme/ 12 Ume˚ a University, Sweden
(continued)
These criteria works well for social networks and electronic circuits, but gives only trivial clusters for biochemical networks. Modified criteria Idea: Networks with some degree of autonomy have loops. To implement this idea, consider the subnetworks with substrate vertex set S′ that fulfills: L(S′) Λ|S′| , (5) where L(S′) is the number of vertices in S′ that lies on an elementary cycle (a closed non- self-intersecting path) of only vertices in S′ and length larger than three, |S′| is the number
0.5 < Λ 1 gives sensible subnetworks.
http://www.tp.umu.se/∼holme/ 13 Ume˚ a University, Sweden
α CoA D−glucosamine 1−phosphate −acetyldihydrolipoamide acetyl−CoA dihydrolipoamide deoxyguanosine 2−deoxy−D−ribose 1−phosphate deoxyadenosine guanine guanosine −D−ribose 1−phosphate adenine adenosine hypoxanthine inosine
−D−ribose 1−pyrophosphate −acetyl−D−glucosamine 1−phosphate α α S N
(a) (b)
N α S
Treponema pallidum
pyruvate, CO2 −D−ribose 1−phosphate
iii ii i
CoA
adenine deoxyadenosine inosine adenosine hypoxanthine guanine guanosine deoxyguanosine D−glucosamine 1−phosphate 1−phosphate −acetyl−D−glucosamine acetyl−CoA dihydrolipoamide −D−ribose 1−pyrophosphate −acetyldihydrolipoamide pyrophosphate 2−deoxy−D−ribose 1−phosphate iii ii i substrate reaction node link in−flow
H O
2
ATP, ADP pyrophosphate NADPH, NADH H O
2
CO2
http://www.tp.umu.se/∼holme/ 14 Ume˚ a University, Sweden
(continued)
(a)
primosome complex 5.99.1.3.DNA topoisomerase II 2.7.7.7.DNA polymerase III DNA helicase II 2.7.7.7.DNA polymerase I SSB
6.5.1.2.DNA ligase Rep 5.99.1.2.DNA topoisomerase I −phosphohistidine
p
N −phosphohistidine −phosphohistidine N HPr protein N−pros− phosphohistidine
p
N enzyme IIIGlc enzyme IIIMan enzyme IIIScr enzyme IIIMan
Glc
enzyme III
p
N enzyme IIIFru
Scr
enzyme III enzyme IIIFru −phosphohistidine HPr protein histidine
p
Mycoplasma pneumoniae
pyruvate
(b)
−phosphohistidine
(c)
CTP GTP
ATP ADP SSB DNA helicase II 6.5.1.2.DNA ligase 2.7.7.7.DNA polymerase I
Rep prepriming complex RNA primer−primosome complex UTP
5.99.1.2.DNA topoisomerase I 2.7.7.7.DNA polymerase III −phosphohistidine enzyme IIIGlc
p
N enzyme IIIFru
p
N −phosphohistidine enzyme IIIScr
p
N enzyme IIIMan enzyme IIIMan enzyme IIIGlc enzyme IIIFru HPr protein phosphohistidine N−pros− enzyme IIIScr
p
N −phosphohistidine phospho enol pyruvate HPr protein histidine primosome complex 5.99.1.3.DNA topoisomerase II
http://www.tp.umu.se/∼holme/ 15 Ume˚ a University, Sweden
Advantages with graph theoretical studies of biochemical networks: Detection of autonomous subnetworks important for both conceptual and analytical purposes. The large-scale structure of biochemical networks can be described. Our method: We deconstruct biochemical networks using a modified version of Girvan & Newman’s algorithm. We emphasize the use of hierarchy-trees. Objective criteria based on presence of loops can be established. We find: that biochemical networks are dominated by its closely connected core surrounded by increasingly loosely connected substances. some interesting subnetworks can be detected.
http://www.tp.umu.se/∼holme/ 16 Ume˚ a University, Sweden