Disclosure This presentation will reference the use of inhaled - - PowerPoint PPT Presentation

disclosure
SMART_READER_LITE
LIVE PREVIEW

Disclosure This presentation will reference the use of inhaled - - PowerPoint PPT Presentation

4/20/2018 Disclosure This presentation will reference the use of inhaled Post-discharge respiratory outcomes nitric oxide and calfactant for prevention of in extreme prematurity bronchopulmonary dysplasia (BPD), which is not approved for


slide-1
SLIDE 1

4/20/2018 1

Post-discharge respiratory outcomes in extreme prematurity

Roberta L. Keller MD Benioff Children’s Hospital April 20, 2018

Disclosure

  • This presentation will reference the use of inhaled

nitric oxide and calfactant for prevention of bronchopulmonary dysplasia (BPD), which is not approved for off-label use for this indication.

Outline

  • Bronchopulmonary dysplasia (BPD)
  • Post-discharge respiratory outcomes in former

preterm infants

  • BPD as predictor of post-discharge respiratory
  • utcomes
  • Other considerations in evaluations of post-discharge

respiratory outcomes

BRONCHOPULMONARY DYSPLASIA

slide-2
SLIDE 2

4/20/2018 2

What is BPD? The origins

  • Chronic lung disease of

prematurity

  • “Old” BPD

Scarring and fibrosis of the lung, severe airway disease in surviving preterm babies in association with high ventilator pressure + FiO2

(Northway 1967)

  • “New” BPD

Impaired lung and vascular development due to extreme prematurity (< 28-30 weeks’ gestation) (Jobe 1999)

What is BPD? The neonatologist’s perspective

GA (n) PMA off O2 25 (31) 32.9 ± 3.3 26 (44) 33.3 ± 2.9 27 (56) 31.2 ± 3.5 28 (83) 30.7 ± 2.7 29 (79) 30.8 ± 2.5 30 (70) 31.0 ± 1.7 31 (49) 31.5 ± 1.2 32 (37) 32.5 ± 1.1 PMA Sensitivity Specificity PPV NPV 31 88 31 36 85 32 82 51 38 88 33 76 64 40 89 34 70 78 48 90 35 66 85 55 90 36 63 91 63 90 37 51 95 71 89 38 43 97 77 87

Shennan 1988

Normal outcome: GA + mean PMA off O2 Abnormal outcome: PMA with

  • ngoing supplemental O2

Cohort n=605: 119 with “abnormal” 1 y outcome (20%)

What is BPD? The pathologist’s perspective

Pathology of BPD: Developmental arrest, alveolar simplification

Cannalicular Saccular Alveolar

Hislop 2002

Term BPD

Bhatt 2001

Stages of lung development

slide-3
SLIDE 3

4/20/2018 3

What is BPD? The pulmonologist’s perspective

Former preterm infant (any of the following):

  • Extended need for assisted

ventilation

  • Abnormal CXR
  • Discharged on oxygen
  • Symptomatic respiratory

disease after discharge

What is BPD? Current definition

< 32 weeks’ GA Assessed at 36 weeks’ PMA

Treatment with oxygen for at least 28d plus Mild Room air Moderate < 30% (effective) FiO2 Severe ≥ 30% (effective) FiO2 or positive pressure (PPV or NCPAP)

NICHD/NHLBI/ORD Workshop Summary June 1-2, 2000, Jobe and Bancalari, 2001

Should reflect usual status for several days prior to and after 36 weeks’ PMA No requirement for abnormal CXR

What is BPD? Physiologic/clinical trials definition

< 32 weeks’ GA Assessed at 36 weeks’ PMA

None Room air Moderate-to- severe Supplemental oxygen or positive pressure Physiologic challenge for nasal cannula with FiO2 0.21: ~2/3 pass flow reduction challenge (~1/3 fail, unable to maintain oxygen saturation ≥ 90% off support): Walsh et al 2006: 7/22 fail Poindexter et al 2015: 26/81 fail

slide-4
SLIDE 4

4/20/2018 4

What is BPD? Physiologic/clinical trials definition

< 32 weeks’ GA Assessed at 36 weeks’ PMA

None Room air Moderate-to- severe Supplemental oxygen or positive pressure Physiologic challenge for nasal cannula with FiO2 0.21: ~2/3 pass flow reduction challenge (~1/3 fail, unable to maintain oxygen saturation ≥ 90% off support): Walsh et al 2006: 7/22 fail Poindexter et al 2015: 26/81 fail

POST-DISCHARGE RESPIRATORY OUTCOMES

How do we assess morbidity post- discharge?

  • No gold standard

– Pulmonary function tests? – What matters to families, patients?

  • Individual domains of morbidity/resource utilization

– home respiratory support – hospitalization for respiratory cause – respiratory medication use – symptoms (e.g., wheeze, cough)

  • Composite outcomes

– multiple events and/or multiple time points

  • Severity outcomes

– scale, weighted score

Outcomes: individual domains

Hibbs 2008 NO CLD (12 mo) Stevens 2014 SUPPORT (18-22 mo) Keller 2017 TOLSURF (12 mo) Any home O2 /support 44% 23% 46% Any respiratory medication 63% Bronchodilator 47% 51% Diuretic 24% 6% 21% Inhaled steroid 26% 26% 31% Systemic steroid 14% 9% 16% Hospitalization 22% 31% 28% Cough 31% 44% Wheeze 53% 61% 52%

slide-5
SLIDE 5

4/20/2018 5

Outcomes: composite

PROP = Prematurity + Respiratory Outcomes Program TOLSURF= Trial of Late Surfactant

  • Quarterly parent surveys (3, 6, 9, 12 mos corrected age)
  • Post-prematurity respiratory disease (PRD)

– Primary outcome: PROP – At least one domain of morbidity on ≥ 2 surveys

  • No pulmonary morbidity (No PM)

– Co-primary follow up outcome: TOLSURF – No resource utilization through 12 mos

  • Persistent pulmonary morbidity (Persistent PM)

– Resource utilization on ≥ 3 surveys

Keller et al J Peds 2017; 2017

Composite outcomes: distribution

Study Adverse outcome Beneficial outcome PROP (n=724) PRD No PRD 497 (69%) 224 (31%) TOLSURF (n=439) Any PM No PM 329 (75%) 110 (25%) TOLSURF (n=426) Persistent PM No persistent PM 153 (36%) 273 (64%) Colorado (n=524) Late RD No Late RD 372/524 (71%) 152/524 (29%)

Keller et al 2017; 2017; Morrow et al 2017

Severity outcomes: count of morbidities

NO CLD

respiratory medications, hospitalizations, home O2 Problems iNO (n=227) PLB (n=222) Total (n=449) 64 (28%) 40 (18%) 104 (23%) 1 72 (32%) 65 (29%) 137 (31%) 2 37 (16%) 44 (20%) 81 (18%) 3 26 (11%) 24 (11%) 50 (11%) 4 22 (10%) 27 (12%) 49 (11%) 5 5 (2%) 14 (6%) 19 (4%) 6 1 (0.4%) 8 (4%) 9 (2%)

P=0.01 for treatment effect

Problems iNO (n=227) PLB (n=222) Total (n=449) 64 (28%) 40 (18%) 104 (23%) 1 72 (32%) 65 (29%) 137 (31%) 2 37 (16%) 44 (20%) 81 (18%) 3 26 (11%) 24 (11%) 50 (11%) 4 22 (10%) 27 (12%) 49 (11%) 5 5 (2%) 14 (6%) 19 (4%) 6 1 (0.4%) 8 (4%) 9 (2%)

P=0.01 for treatment effect

NNT = 10 to prevent morbidity in 1st year

Severity outcomes: count of morbidities

NO CLD

respiratory medications, hospitalizations, home O2

slide-6
SLIDE 6

4/20/2018 6

Severity score: CPQCC

Clinical Factor Weight Clinical Factor Weight Severity n = 940 Supplemental O2 2.5 Severe (5-8.5) 70 (7%) Respiratory hospitalization 2.5 Diuretic therapy 1.5 Medium (2.1-4.9) 221 (24%) Daily bronchodilator (BD) 1.0 Intermittent BD 0.5 Low (0.1-2.0) 107 (11%) Daily inhaled corticosteroids (ICS) 1.0 Intermittent ICS 0.2 Chest PT None (0) 542 (58%)

Gage 2015

Score: 0-8.5, Higher score indicates more morbidity

Severity scale: PROP

Respiratory morbidity severity (RMS)

Severe Moderate/Mild Minimal/None Respiratory medications Sys Ster any Pulm Vasodil any BD ≥ 2 time points Inhaled CS any No ICS/SS/PV Respiratory hospitalizations ≥ 2 any time 1 any time None Symptoms At 2 time points: Wheeze/Cough ≥ 1/wk + ICS At 2 time points: Wheeze/Cough ≥ 1/wk Wheeze/Cough < 1/wk or < 2 time points Home respiratory support O2 after 3 mos Vent any time O2 3 mos only Trache without vent None Death due to respiratory cause X

Keller et al J Peds 2017

Severity scales: distribution

CPQCC <1500g, < 30 wks BPD 100% (n=940) PROP < 29 wks BPD ~43% (n = 704) TOLSURF ≤ 28 0/7, intubated 7-14d BPD ~65% (n = 454) Severe 7% 35% 45% Moderate/Mild 35% 38% 23% Minimal/None 58% 28% 31%

slide-7
SLIDE 7

4/20/2018 7

BPD AS PREDICTOR OF RESPIRATORY OUTCOMES

BPD: predictor of respiratory morbidity

  • ≤ 1000 g, NRN (n=3848), 18-22 months corrected age, 1995-99
  • BPD definition (NICHD/NHLBI workshop 2000, Jobe & Bancalari 2001)

– none: off O2/support at 28d – mild: O2/support ≥ 28d, FiO2 21% at 36 weeks’ – moderate: < 30% FiO2 at 36 weeks’ (including all use of nasal cannula) – severe: ≥ 30% FiO2 or PPV at 36 weeks’

Ehrenkranz Pediatrics 2005

*P<0.001; **P<0.0001

Pulmonary medication Pulmonary rehospitalization Weight <10th %ile Length <10th %ile None 27.2% 23.9% 48.8% 30.6% Mild 29.7% 26.7% 49.8% 28.9% Moderate 40.8% 33.5% 55.2% 37.9% Severe 46.6%* 39.4%* 62.6%** 46.2%**

BPD: predictor of respiratory morbidity

  • < 29 wks, 13 US sites (n=709), 12 months corrected age, 8/2011-10/2013
  • Post-prematurity respiratory disease (PRD): 69% prevalence
  • BPD definition (Jobe & Bancalari 2001, Poindexter 2015)

– None/mild: FiO2 21% at 36 wk – moderate: < 30% FiO2 at 36 wk (including any level of flow by nasal cannula) – severe: ≥ 30% FiO2 or PPV at 36 wk

PRD P value BPD <0.001 None/mild 60.1% Moderate 71.4% Severe 82.0%

Keller et al J Peds 2017

BPD: predictor of morbidity TOLSURF severity score

BPD at 36 wks BPD at 40 wks

5 10 15 Morbidity score No Yes

■ Regular P = 0.001 ■ Severe P < 0.0001

5 10 15 Morbidity score No Yes

■ Regular P = 0.001 ■ Severe P < 0.0001

Score range: 0 – 20.625 (Severe 21.625) Higher  more morbidity

slide-8
SLIDE 8

4/20/2018 8

BPD: predictor of respiratory morbidity?

Sensitivity Specificity PPV NPV Correctly Classified Shennan 1988 (20% with outcome) 28d 79 69 38 93 71% BPD36 63 91 63 90 85% Davis 2002 (54% with outcome) BPD36 46 82 75 57 63% TOLSURF—BPD36 (25 and 36% with outcome) Any PM 70 52 81 38 65% Persistent PM 92 43 29 96 53%

Predictors of PRD: Perinatal vs. 36-week models (n=697)

Perinatal 36-week Characteristic OR (95% CI) P value OR (95% CI) P value GA per week 0.90 (0.79, 1.04) 0.15 1.00 (0.86, 1.16) 0.99 IUGR 2.57 (0.82, 8.09) 0.11 2.32 (0.70, 7.63) 0.16 Male sex 1.96 (1.36, 2.83) <0.001 1.74 (1.20, 2.54) 0.004 Smoking in pregnancy 1.70 (1.01, 2.89) 0.047 1.66 (0.97, 2.84) 0.07 Intubation at birth 1.47 (0.95, 2.29) 0.09 1.36 (0.87, 2.14) 0.18 Infant Race/ethnicity White/non- Hispanic 1.00 (REF) 0.03 1.00 (REF) 0.01 Black/AA 1.59 (1.01, 2.50) 1.83 (1.15, 2.91) Hispanic white 0.62 (0.32, 1.19) 0.69 (0.35, 1.33) Other/Multi 0.84 (0.37, 1.88) 0.88 (0.38, 2.02)

Keller et al J Peds 2017

Perinatal 36-week Characteristic OR (95% CI) P value OR (95% CI) P value Public insurance 1.57 (1.03, 2.40) 0.04 1.47 (0.95, 2.26) 0.08 Parent with asthma 1.40 (0.89, 2.21) 0.14 Human milk < 28d 2.21 (1.08, 4.51) 0.03 Growth failure at 36 wks’ 1.32 (0.88, 1.99) 0.18 BPD at 36 wks’ No/Mild 1.00 (REF) <0.001 Moderate 1.73 (0.98, 3.08) Severe 2.70 (1.68, 4.33)

Predictors of PRD: Perinatal vs. 36-week models (n=697)

Keller et al J Peds 2017

ROC curve: Perinatal vs. 36-week models

C-statistic (AUC) Perinatal model 0.858 — 36-week model 0.856 −−

Keller et al J Peds 2017

slide-9
SLIDE 9

4/20/2018 9

ROC curves: Perinatal model + BPD

C-statistic (AUC) Perinatal model 0.858 — Perinatal + BPD 0.860 −− BPD alone 0.907

  • ·-·

Keller et al J Peds 2017

Perinatal vs. Neonatal models of PRD: explanatory effects of BPD?

Perinatal 36-week Characteristic OR (95% CI) P value OR (95% CI) P value Decreased effect in 36-week model GA per week 0.90 (0.79, 1.04) 0.15 1.00 (0.86, 1.16) 0.99 IUGR 2.57 (0.82, 8.09) 0.11 2.32 (0.70, 7.63) 0.16 Male sex 1.96 (1.36, 2.83) <0.001 1.74 (1.20, 2.54) 0.004 Parent with asthma 1.40 (0.89, 2.21) 0.14 Increased effect in 36-week model Infant Race/ethnicity White/non- Hispanic 1.00 (REF) 0.03 1.00 (REF) 0.01 Black/AA 1.59 (1.01, 2.50) 1.83 (1.15, 2.91)

Keller et al J Peds 2017

OTHER CONSIDERATIONS: PITFALLS + PROBLEMS

The NO CLD trial

  • Nitric oxide to prevent chronic lung disease (Ballard RA, NEJM

2006, 2007)

  • 24 days of iNO initiated at 20 ppm versus placebo
  • Increase in Survival without BPD
  • Suggestion of differential effect of iNO by self-reported

maternal race/ethnicity

Maternal race/ethnicity Relative benefit of iNO P value White/Caucasian 1.06 (0.76, 1.47) 0.06 Black/African-American 1.72 (1.20, 2.47) Hispanic 1.66 (1.06, 2.59) Other 0.54 (0.25, 1.14)

Ballard NEJM 2006, 2007

slide-10
SLIDE 10

4/20/2018 10

The NO CLD trial

  • Nitric oxide to prevent chronic lung disease (Ballard RA, NEJM

2006, 2007)

  • 24 days of iNO initiated at 20 ppm versus placebo
  • Increase in Survival without BPD
  • Suggestion of differential effect of iNO by self-reported

maternal race/ethnicity

Maternal race/ethnicity Relative benefit of iNO P value White/Caucasian 1.06 (0.76, 1.47) 0.06 Black/African-American 1.72 (1.20, 2.47) Hispanic 1.66 (1.06, 2.59) Other 0.54 (0.25, 1.14)

Ballard NEJM 2006, 2007

Race effects of inhaled nitric oxide in preterm infants (RiNOP)

Criteria for included studies:

  • Blinded RCT
  • Enrolled ≥ 50 preterm infants
  • ≥ 15% Black/African-American
  • iNO initiated at > 5 ppm
  • Plan to treat ≥ 7 days

3 trials including 1240 infants met inclusion criteria

Schreiber et al 2003; Ballard et al 2006, 2007; Hasan 2017

Askie et al J Peds 2018

RiNOP: BPD or death by maternal race

Maternal race iNO (n=628) Placebo (n=612) RR (95% CI) P value Overall 58% 65% 0.89 (0.81, 0.97) 0.01 White 65% 66% 0.99 (0.87, 1.12) 0.87 Hispanic 52% 62% 0.83 (0.64, 1.06) 0.14 Black 49% 63% 0.77 (0.65, 0.91) 0.003 Other 58% 69% 0.77 (0.51, 1.16) 0.21

P=0.016 for interaction

NNT = 7 to improve outcome at 36 weeks for infants of black mothers

Askie et al J Peds 2018

slide-11
SLIDE 11

4/20/2018 11

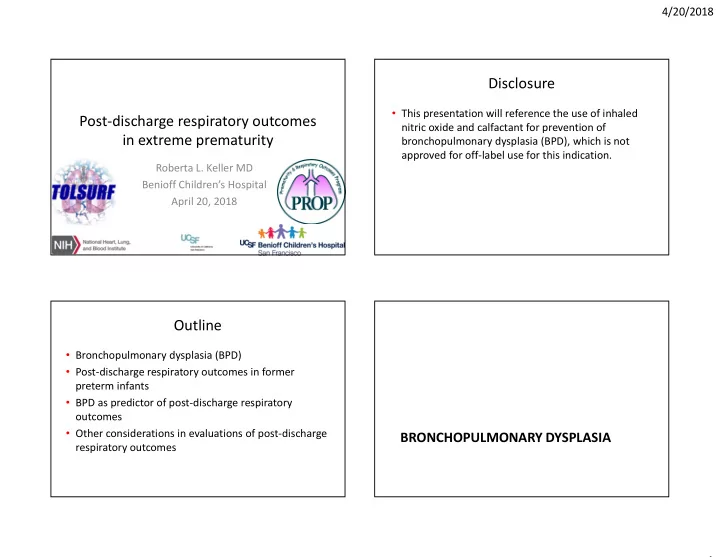
The Trial of Late Surfactant (TOLSURF)

  • Randomized, blinded, controlled trial (n=511)

– Late doses of calfactant (Infasurf) plus inhaled nitric oxide (iNO) vs. iNO-alone – High risk of BPD: ≤ 28 0/7 wks’ GA, intubated 7-14 days of age

  • Primary outcome: Survival without bronchopulmonary

dysplasia (BPD) at 36 wks’ post-menstrual age

– Determined by O2/flow reduction – No difference by treatment (late surfactant) (Ballard et al, 2016)

  • Informed consent: infant genetic studies opt-in/opt-out

Survival without BPD by maternal race/ethnicity

Population n/N (%) Full cohort 161/511 (32%) Maternal race/ethnicity White/Caucasian 62/244 (25%) Black/African-American 70/188 (37%) Hispanic 17/54 (31%) Other 12/25 (48%)

Survival without BPD: African ancestry

Genetic cohort (n=414) Race/ethnicity model Ancestry model OR (95% CI) P value OR (95% CI) P value African ancestry 2.6 (1.4, 4.8) 0.002 Maternal race/ethnicity White/Caucasian reference African-American 2.6 (1.5, 4.4) 0.0004 Hispanic 1.7 (0.8, 3.6) 0.19 Other 2.4 (0.9, 6.6) 0.08 Birth weight 1.4 (1.1, 1.7) 0.004 1.3 (1.1, 1.6) 0.005 Birth weight centile 0.7 (0.2, 2.4) 0.61 0.7 (0.2, 2.3) 0.59 Male sex 0.4 (0.3, 0.7) 0.001 0.4 (0.2, 0.7) 0.0003 Multiple gestation 1.2 (0.7, 2.0) 0.41 1.2 (0.7, 2.0) 0.46 RSS at entry 0.7 (0.6, 0.8) <0.0001 0.7 (0.6, 0.8) <0.0001

Keller et al submitted

slide-12
SLIDE 12

4/20/2018 12

TOLSURF 2y respiratory outcome: persistent wheezing illness

  • Doctor diagnosis of asthma at 18-24 mos AND

bronchodilator (BD) or inhaled corticosteroid (ICS) OR wheeze

  • BD/ICS in first year AND wheeze in second year
  • Wheeze in first year AND BD/ICS in second year
  • BD/ICS in first year AND BD/ICS in second year
  • Wheeze at 18 mos AND BD/ICS at 24 mos

Adapted from Litonjua 2015

Persistent wheezing illness by maternal race

Persistent wheeze No persistent wheeze Full cohort (n=420) 45% 55% White, non-Hispanic 36% (75/209) 64% (134/209) White, Hispanic 39% (19/49) 61% (30/49) Black 60% (87/144) 40% (57/144) Other 44% (8/18) 56% (10/18)

Wai et al J Peds 2018

Persistent wheezing illness by maternal race

Persistent wheeze No persistent wheeze Full cohort (n=420) 45% 55% White, non-Hispanic 36% (75/209) 64% (134/209) White, Hispanic 39% (19/49) 61% (30/49) Black 60% (87/144) 40% (57/144) Other 44% (8/18) 56% (10/18)

Wai et al J Peds 2018

Persistent wheezing illness: predictors

Persistent wheeze No persistent wheeze P value Gestational age (wks) 25.2 ± 1.2 25.4 ± 1.2 0.10 Birth weight (g) 734 ± 175 697 ± 157 0.02 Male sex 66% 50% 0.001 Multiple gestation 25% 36% 0.02 Antenatal steroids 82% 97% 0.002 Maternal race <0.001 White, non-Hispanic 40% 58% White, Hispanic 10% 13% Black, non-Hispanic 46% 25% Other 4% 4%

Wai et al J Peds 2018

slide-13
SLIDE 13

4/20/2018 13

Mediation: effects of maternal race on wheeze

OR (95% CI) P value Black race 2.9 (1.9, 4.5) <0.001 Black race Furry pet in home 3.3 (1.9, 5.5) 1.2 (0.7, 1.2) <0.001 0.51 Black race Maternal education: ≥ college graduate 2.7 (1.7, 4.3) 0.8 (0.5, 1.3) <0.001 0.40 Black race Anticipated breast milk exposure 2.7 (1.7, 4.2) 0.6 (0.4, 1.0) <0.001 0.04 Black race Public insurance status 2.5 (1.5, 4.0) 1.7 (1.0, 2.6) <0.001 0.03 Black race BPD 3.5 (2.2, 5.6) 2.4 (1.6, 3.8) <0.001 <0.001

All models adjusted for GA, BW and sex

Wai et al J Peds 2018

Direct + indirect effects of maternal race

Direct effect Indirect effect Maternal race 69% Breast milk exposure 8% Public insurance status 12% BPD* 10%

Adjusted for GA, BW and sex *Negative mediator

Wai et al J Peds 2018

Conclusions

  • Composite and severity post-discharge respiratory
  • utcomes may best assess burden of disease in

former preterm infants

  • Biologic, socioeconomic and environmental factors

influence post-discharge respiratory outcomes

– BPD may be a reasonable predictor of later respiratory

  • utcomes in some sub-populations of interest
  • Analyses should consider differential outcomes by

race/ethnicity + ancestry

Thanks!

  • UCSF: Roberta + Phil Ballard, Liz Rogers, Kathy Wai, Leslie

Lusk

  • Paul Moore (Vanderbilt), Carol Blaisdell (NHLBI)
  • TOLSURF + PROP sites + families
  • Burchard Lab (UCSF)
  • Funding (NHLBI):

HL094338 (TOLSURF, Ballard) HL101798 (PROP, Keller)

slide-14
SLIDE 14

4/20/2018 14

Questions? Measurements during PFT Preterm pulmonary function

Friedrich 2007 n = 26 Robin 2004 n = 28 Fawke 2010 n = 182 Age (wks) 10 (3-31) 64 (47-97) 68 (31-150) 11 yr (10-12) FVC no diff increased (ns) no diff lower FEV0.5 lower (ns) lower (ns) lower lower* FEV0.5/FVC* lower lower lower* FEF25-75 lower lower lower lower FEF75 lower lower lower RV increased bronchodilator response 35% n = 18 27% n = 161

*FEV1 + FEV1/FVC

Maternal race/ethnicity vs. infant ancestry

Proportion African Proportion Native American Maternal race/ethnicity

  • Black/African American
  • Hispanic
  • Both
  • Neither
slide-15
SLIDE 15

4/20/2018 15

Is prediction for 40 weeks better?

Sensitivity Specificity PPV NPV Correctly Classified Shennan 1988 (20% with outcome) BPD36 63 91 63 90 85% Davis 2002 (54% with outcome) BPD36 46 82 75 57 63% BPD40 33 96 90 55 62% TOLSURF—PM (75% with outcome) BPD36 70 52 81 38 65% BPD40 45 93 95 37 57% TOLSURF—Persistent PM (36% with outcome) BPD36 92 43 29 96 53% BPD40 73 74 41 92 74%

BPD: predictor of respiratory morbidity?

Sensitivity Specificity PPV NPV Shennan 1988 (n=605) 28d 79 69 38 93 BPD36 63 91 63 90 Ehrenkranz 2005 (n=3848)—BPD 36 Medication 54 62 44 71 Hospitalization 52 60 36 74 Growth failure 50 58 58 51

BPD: predictor of respiratory morbidity?

Sensitivity Specificity PPV NPV Stevens 2014 (n=916)—BPD 36 Wheeze >2 days in 1 week 44 62 52 55 Inhaled corticosteroids 56 64 36 80 Respiratory hospitalization 51 64 39 74