
SLIDE 1
Development of Probabilistic Environmental Fatigue Lifetime Model for Ni-Base Alloys Using End-of-Life Data
Jae Phil Park a, Chi Bum Bahn a*
aSchool of Mechanical Engineering, Pusan National University, Busan 46241, Republic of Korea *Corresponding author: bahn@pusan.ac.kr
- 1. Introduction
The fatigue life of nuclear power plant components is estimated based on the fatigue design curve described in the ASME Boiler & Pressure Vessel Code Section III [1, 2]. The design curve is based on the best fitting curve of fatigue life for a given stress/strain amplitude data, and after, conservatively corrected to consider the associated uncertainties (e.g., surface finish, material grade). However, there is a limitation that the fatigue design curve is basically estimated based on fatigue test data performed in an in-air environment. Decades ago, when the initial nuclear power plant was designed, it was considered that there was no problem in the use of the fatigue design curve. However, as the nuclear power plant aged, it has been reported that the environmental effect of corrosion greatly shortened the fatigue life (i.e., environmental fatigue). Thus, Reg. Guide 1.207 requires the fatigue life to be corrected by the existing design curve by an additional environmental correction factor to account for these environmental effects for nuclear components in LWR(Light Water Reactor) coolant environments [3]. In this work, the objective is to extend the above fatigue life prediction approach from deterministic to
- probabilistic. The probabilistic approach has the
following two advantages: 1) The probabilistic model can quantify the safety margin as a level of failure
- probability. 2) In the model estimation step, the
probabilistic approach can account for the censored data in the test, which are usually neglected in the deterministic approach.
- 2. Literature Survey and Data Extraction
For Ni-based alloys and weldments except for Alloy 718, the ASME fatigue design curve is specified to follow the fatigue design curve of AuSS (Austenitic Stainless Steel) material [1, 2]. The best fit S- N(stress/strain amplitude vs. fatigue life) curve for AuSS and Ni-based Alloys is ln 𝑂
𝑔,Air = 6.891 − 1.920 ln(𝜁𝑏 − 0.112)
(1) where, 𝑂
𝑔,Air is the in-air fatigue life (cycles), and 𝜁𝑏 is
the strain amplitude (%). The fatigue design curve is then calculated using an adjustment life factor of 12 and stress/strain factor of 2 based on the best fit S-N curve (Eq. 1). The environmental correction factors for nickel-based alloys and welding materials covered in this study are presented as a function of temperature, strain rate, and dissolved oxygen (DO) values as follows [2].
𝐺
en =
𝑂
𝑔,air
𝑂
𝑔,water
= exp(−𝑈∗𝜁̇∗𝑃∗)
(2a)
𝑈∗ = { (𝑈 < 50 ℃) 𝑈 − 50 275 (50 ℃ ≤ 𝑈 ≤ 325 ℃)
(2b)
𝜁̇∗ = { (𝜁̇ > 5.0%/𝑡) ln 𝜁̇ 5 (0.0004 %/𝑡 ≤ 𝜁̇ ≤ 5.0 %/𝑡) ln 0.0004 5 (𝜁̇ < 0.0004 %/𝑡)
(2c)
𝑃∗ = {0.06 (BWR water, DO ≥ 0.1 ppm) 0.14 (PWR water, DO < 0.1 ppm)
(2d) where, 𝐺
en is the environmental correction factor, and
𝑂
𝑔,water is the LWR-water fatigue life, 𝑈 is the
temperature (°C), 𝜁̇ is the strain rate (%/s), 𝑈∗, 𝜁̇∗, 𝑃∗ are the effect terms of temperature, strain rate, and DO,
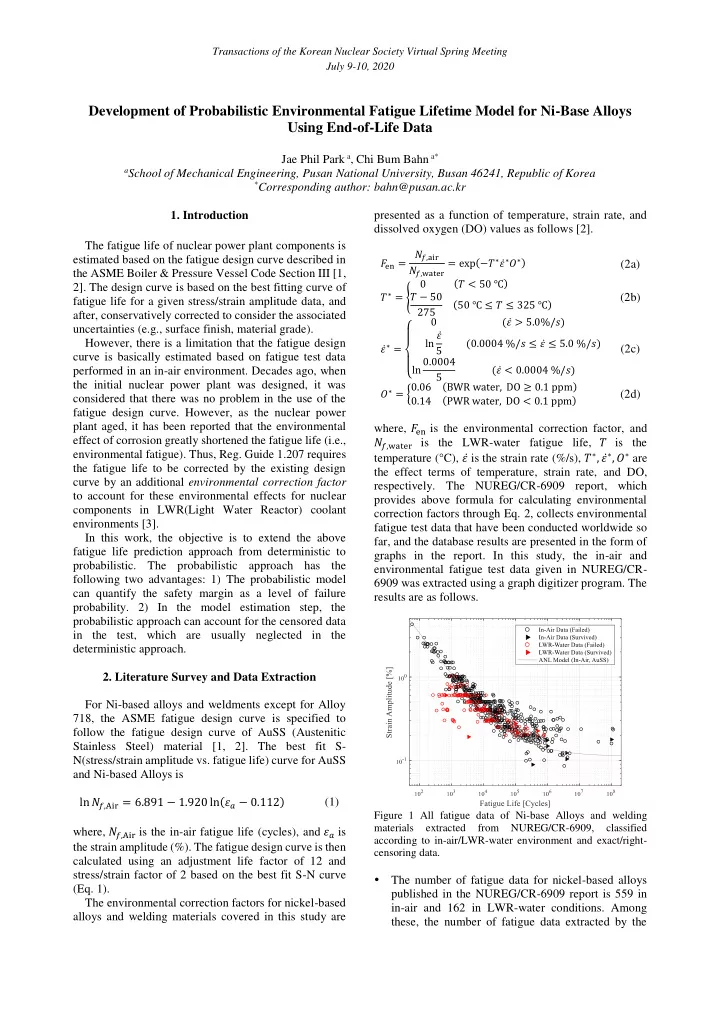
- respectively. The NUREG/CR-6909 report, which