development and validation of a code for the oxygen
play

Development and Validation of a Code for the Oxygen Distribution of - PDF document

Transactions of the Korean Nuclear Society Virtual Spring Meeting July 9-10, 2020 Development and Validation of a Code for the Oxygen Distribution of Zircaloy Cladding in Non-Isothermal Transient Steam Oxidation Dongju Kim , Kyunghwan Keum ,


  1. Transactions of the Korean Nuclear Society Virtual Spring Meeting July 9-10, 2020 Development and Validation of a Code for the Oxygen Distribution of Zircaloy Cladding in Non-Isothermal Transient Steam Oxidation Dongju Kim , Kyunghwan Keum , Hyunwoo Yook, Youho Lee * Seoul National University, 1 Gwanak-ro, Gwanak-gu, Seoul 08826, Korea * Corresponding author: leeyouho@snu.ac.kr πœ–π· πœ– πœ–π· 1. Introduction πœ–π‘’ = π‘ πœ–π‘  (𝐸𝑠 πœ–π‘  ) (1) Retention of an adequate level of Post-LOCA cladding 
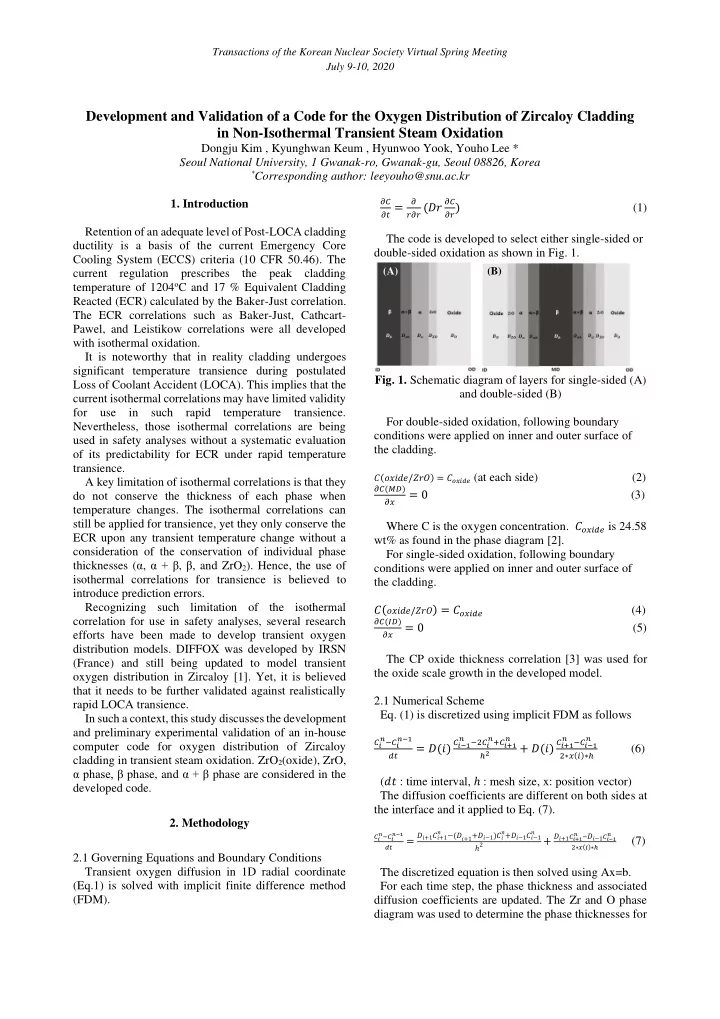
The code is developed to select either single-sided or ductility is a basis of the current Emergency Core double-sided oxidation as shown in Fig. 1. Cooling System (ECCS) criteria (10 CFR 50.46). The (A) (B) current regulation prescribes the peak cladding temperature of 1204 o C and 17 % Equivalent Cladding Reacted (ECR) calculated by the Baker-Just correlation. The ECR correlations such as Baker-Just, Cathcart- Pawel, and Leistikow correlations were all developed with isothermal oxidation. It is noteworthy that in reality cladding undergoes significant temperature transience during postulated Fig. 1. Schematic diagram of layers for single-sided (A) Loss of Coolant Accident (LOCA). This implies that the and double-sided (B) current isothermal correlations may have limited validity for use in such rapid temperature transience. For double-sided oxidation, following boundary Nevertheless, those isothermal correlations are being conditions were applied on inner and outer surface of used in safety analyses without a systematic evaluation the cladding. of its predictability for ECR under rapid temperature transience. 𝐷(𝑝𝑦𝑗𝑒𝑓/π‘Žπ‘ π‘ƒ) = 𝐷 𝑝𝑦𝑗𝑒𝑓 (at each side) (2) A key limitation of isothermal correlations is that they πœ–π·(𝑁𝐸) = 0 (3) do not conserve the thickness of each phase when πœ–π‘¦ temperature changes. The isothermal correlations can still be applied for transience, yet they only conserve the Where C is the oxygen concentration. 𝐷 𝑝𝑦𝑗𝑒𝑓 is 24.58 ECR upon any transient temperature change without a wt% as found in the phase diagram [2]. consideration of the conservation of individual phase For single-sided oxidation, following boundary thicknesses ( Ξ± , Ξ± + Ξ² , Ξ² , and ZrO 2 ). Hence, the use of conditions were applied on inner and outer surface of isothermal correlations for transience is believed to the cladding. introduce prediction errors. Recognizing such limitation of the isothermal 𝐷( 𝑝𝑦𝑗𝑒𝑓/π‘Žπ‘ π‘ƒ ) = 𝐷 𝑝𝑦𝑗𝑒𝑓 (4) correlation for use in safety analyses, several research πœ–π·(𝐽𝐸) = 0 (5) efforts have been made to develop transient oxygen πœ–π‘¦ distribution models. DIFFOX was developed by IRSN The CP oxide thickness correlation [3] was used for (France) and still being updated to model transient the oxide scale growth in the developed model. oxygen distribution in Zircaloy [1]. Yet, it is believed that it needs to be further validated against realistically 2.1 Numerical Scheme rapid LOCA transience. Eq. (1) is discretized using implicit FDM as follows In such a context, this study discusses the development and preliminary experimental validation of an in-house π‘œ βˆ’2𝐷 𝑗 π‘œ βˆ’π· π‘—βˆ’1 π‘œ βˆ’π· 𝑗 π‘œβˆ’1 π‘œ +𝐷 𝑗+1 π‘œ π‘œ 𝐷 𝑗 𝐷 π‘—βˆ’1 𝐷 𝑗+1 computer code for oxygen distribution of Zircaloy = 𝐸(𝑗) + 𝐸(𝑗) 2βˆ—π‘¦(𝑗)βˆ—β„Ž (6) β„Ž 2 𝑒𝑒 cladding in transient steam oxidation. ZrO 2 (oxide), ZrO, Ξ± phase, Ξ² phase, and Ξ± + Ξ² phase are considered in the ( 𝑒𝑒 : time interval, β„Ž : mesh size, x: position vector) developed code. The diffusion coefficients are different on both sides at the interface and it applied to Eq. (7). 2. Methodology π‘œ π‘œ +𝐸 π‘—βˆ’1 𝐷 π‘—βˆ’1 π‘œ π‘œ βˆ’ 𝐸 π‘—βˆ’1 𝐷 π‘—βˆ’1 π‘œ βˆ’π· 𝑗 π‘œβˆ’1 𝐸 𝑗+1 𝐷 𝑗+1 βˆ’(𝐸 𝑗+1 +𝐸 π‘—βˆ’1 )𝐷 𝑗 π‘œ + 𝐸 𝑗+1 𝐷 𝑗+1 𝐷 𝑗 = (7) β„Ž 2 2βˆ—π‘¦(𝑗)βˆ—β„Ž 𝑒𝑒 2.1 Governing Equations and Boundary Conditions Transient oxygen diffusion in 1D radial coordinate The discretized equation is then solved using Ax=b. (Eq.1) is solved with implicit finite difference method For each time step, the phase thickness and associated (FDM). diffusion coefficients are updated. The Zr and O phase diagram was used to determine the phase thicknesses for

  2. Transactions of the Korean Nuclear Society Virtual Spring Meeting July 9-10, 2020 given oxygen distribution. Detailed calculation processes The diffusion coefficients and oxide scale growth are illustrated in Fig. 2. models employed in the developed codes are summarized in Table 1. Table 1. Summary of employed models for the developed code Model Reference Oxide scale 35890 πœ— = 0.02252exp (βˆ’ π‘™π‘ˆ )βˆšπ‘’ [3] thickness Diffusion βˆ’34510 𝐸 𝑝 = 0.127exp (βˆ’ ) coefficient of [5] π‘™π‘ˆ Oxide Diffusion 50246 coefficient of 𝐸 𝑨𝑝 = 0.0155exp (βˆ’ π‘™π‘ˆ ) This study ZrO Diffusion 𝐸 𝛽 = 3.92exp (βˆ’51000 coefficient of ) [5] π‘™π‘ˆ Ξ± Diffusion 68478 𝐸 𝑏𝑐 = 1016.5exp (βˆ’ π‘™π‘ˆ ) coefficient of This study Ξ± + Ξ² Diffusion 𝛾 = 0.0248exp (βˆ’28200 coefficient of 𝐸 ) [4] π‘™π‘ˆ Ξ² Fig. 2. Flow diagram of numerical procedure By applying the obtained equations and executing the 3. Determination of diffusion coefficients code, oxygen distribution over temperature and time can be obtained as shown in Fig.4. Also, information about In the case of Ξ±, Ξ², and oxide layers, the diffusion the thickness and location of each phase can be obtained. coefficients from the existing literatures [4-5] were used. For ZrO and Ξ± + Ξ² representation, simulations have been used to find pairs that can accurately match the ECR and Ξ± layer thickness of CP correlation . ECR and Ξ± layer thickness were used as a measure of the code’s predictability against the CP correlation. The diffusion coefficients of ZrO and Ξ± + Ξ² that give the best agreement with CP correlation’s ECR and Ξ± layer thickness were selected. As a following step, diffusion coefficient correlations were developed by fitting the obtained diffusion coefficients over the temperature range of 900 – 1400 o C in Arrhenius plot (Fig.3). ECR and Ξ± layer thicknesses grow parabolic over time. Therefore, after plotting each value for βˆšπ‘’ , the linear fitting slopes of obtained ( πœ€ 𝐹𝐷𝑆 , πœ€ 𝛽 ) were compared with the values of the CP correlation. In the isothermal Fig. 4. Oxygen distribution of cladding at 1204 ℃ with simulation, 𝐸 𝑨𝑝 and 𝐸 𝑏𝑐 values were changed at regular 590 s of oxidation intervals, and the pair with the smallest RMS value of the error of the two coefficients was selected as the diffusion As shown in the Fig.5, it is possible to obtain coefficient of each temperature . information on the thickness of the remaining Ξ² over time, so it can help to predict the ductility of cladding. In the (A) (B) early stage, the thickness decreases at a rapid rate, and the reduction rate decreases with time. Fig. 3. Arrhenius fitting of obtained diffusion coefficient for ZrO (A) and Ξ± + Ξ² (B)

  3. Transactions of the Korean Nuclear Society Virtual Spring Meeting July 9-10, 2020 2.2 Validation for Temperature-variant Transient Oxidation A transient oxidation that accompanies a significant temperature variation was conducted [7] as shown in Fig. 8(A). It is noteworthy that the isothermal CP correlation does not provide an accurate prediction for the resulting ECR of this transience (error=14.5%). Considering the remarkable prediction accuracy of the CP correlation for the steady-state oxidation shown in Fig. 6, the presented error is non-negligibly high, and is a consequence of the aforementioned transient effects. Fig. 5. Ξ² layer thickness over time when oxidized at 1204 ℃ (A) 4. Code Validation 2.1 Validation for Isothermal Oxidation The developed code has been validated against steady- state experimental data [6]. As can be seen in Fig. 6, the developed code gives a good agreement with the experimental data. (B) Fig. 8. Temperature profile (A) and ECR data (B) of Fig. 6. Code-calculated ECR and CP-ECR over time temperature-variant oxidation with experiment result while oxidized at 1204 ℃ SEM-EDS analysis (Fig. 9) shows that oxide thickness was somewhat overrated (error=18%) at code result and SEM-EDS analysis (Fig. 7) shows an acceptable level in the bulk metal, code result and the experiment show of agreement for oxygen distribution between the code acceptable agreement. result and the experiment. Fig. 9. Oxygen distribution data of temperature-variant Fig. 7. Oxygen distribution data of ECR 17% sample oxidized sample from EDS and Code from EDS and Code

Download Presentation
Download Policy: The content available on the website is offered to you 'AS IS' for your personal information and use only. It cannot be commercialized, licensed, or distributed on other websites without prior consent from the author. To download a presentation, simply click this link. If you encounter any difficulties during the download process, it's possible that the publisher has removed the file from their server.

Recommend


More recommend