
SLIDE 1
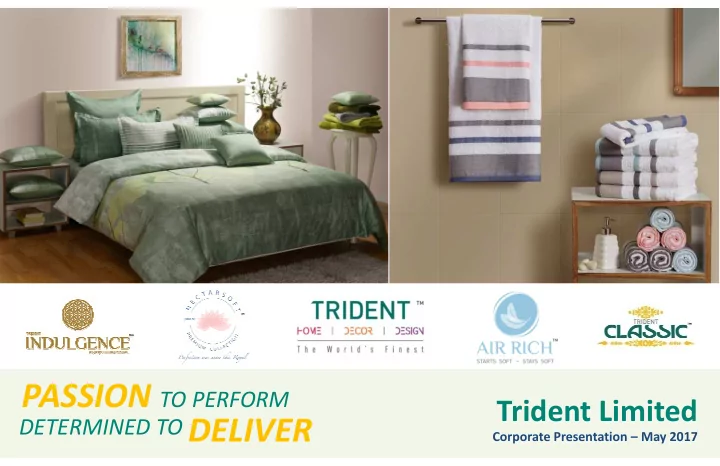
Trident Limited
PASSION TO PERFORM
Corporate Presentation – May 2017
DETERMINED TO DELIVER Corporate Presentation May 2017 Safe Harbour - - PowerPoint PPT Presentation
PASSION TO PERFORM Trident Limited DETERMINED TO DELIVER Corporate Presentation May 2017 Safe Harbour No representation or warranty, express or implied, is made as to, and no reliance should be placed on, the fairness, accuracy,
Corporate Presentation – May 2017
correctness of the information or opinions contained in this presentation. Such information and opinions are in all events not current after the date
looking statements" based on the currently held beliefs and assumptions of the management of the Company, which are expressed in good faith and in their opinion reasonable, including those relating to the Company's general business plans and strategy, its future financial condition and growth prospects and future developments in its industry and its competitive and regulatory environment.
condition, performance or achievements of the Company or industry results to differ materially from the results, financial condition, performance
business, its competitive environment and political, economic, legal and social conditions. Further, past performance is not necessarily indicative of future results. Given these risks, uncertainties and other factors, viewers of this presentation are cautioned not to place undue reliance on these future results. Given these risks, uncertainties and other factors, viewers of this presentation are cautioned not to place undue reliance on these forward-looking statements. The Company disclaims any obligation to update these forward-looking statements to reflect future events or developments.
any particular person. This presentation does not constitute an offer or invitation to purchase or subscribe for any securities of the Company by any person in any jurisdiction, including India and the United States. No part of it should form the basis of or be relied upon in connection with any investment decision or any contract or commitment to purchase or subscribe for any securities. The Company may alter, modify or otherwise change in any manner the content of this presentation, without obligation to notify any person of such change or changes. This presentation may
Corporate Presentation - May 2017 - Trident Ltd. 2
change in any manner the content of this presentation, without obligation to notify any person of such change or changes. This presentation may not be copied or disseminated in any manner.
One of the
Manufacturer
Spinning Unit under Single Roof Manufacturer
Corporate Presentation - May 2017 - Trident Ltd. 3
Manufacturer
Key Market Statistics 31-May-2017
BSE Ticker 521064
Global Presence
Corporate Office : Ludhiana, Punjab NSE Ticker Trident Bloomberg Code TRID:IN Reuters TRIE.NS CMP (Rs) 80.40 Market Cap (INR Crore / USD Mn) 4,097/ 635 Number of Outstanding Shares (Crore) 50.96 Corporate Office : Ludhiana, Punjab Manufacturing Facilities at: Sanghera & Dhaula, Punjab Budni, Madhya Pradesh Marketing Offices (India): Mumbai, Gurgaon Kolkata, Bengaluru Marketing Offices (Intl.): New York, United States Cheshire, United Kingdom Number of Outstanding Shares (Crore) 50.96 Face Value
52-week High / Low (Rs.) 92.3/ 42.0
Shareholding Pattern – 31st March, 2017
Category of Shareholder Shareholding %
Promoters 67.8% Corporate Presentation - May 2017 - Trident Ltd. 4
Global footprint in over 100 countries
Promoters 67.8% Institutions 3.7% Public 28.5%
Spinning Unit
Textile; Acquired 1st Towel Manufacturing
& Spinning; Set-up Towel Unit –II & Spinning
Unit – III; added Spinning Units– IV, V & VI
4839
Spinning Unit Facility Manufacturing facility
Unit - II –II & Spinning Unit-III
Manufacturing facility IV, V & VI
Unit – II
Power Facility
Textile Brands
3744
Revenue (INR Crs
706 1803 Corporate Presentation - May 2017 - Trident Ltd. 5
Crs.)
Transformed from a Yarn player to an integrated Home Textiles manufacturer
47 294 706
1990-95 1996-2000 2001-05 2006-10 2011-16 FY17
CRISIL
A+: Long Term Borrowings Ratings Diversified Board of Directors 75%
Non-Executive
50%
Independent
1
Woman Independent Independent
A+: Long Term Borrowings A1: Short Term Borrowings
CARE
A+: Long Term Borrowings A1: Short Term Borrowings
India Rating
IND A1+ : Commercial Paper
Non-Executive Directors Independent Directors Woman Independent Director
Awards & Recognitions 3 times National Recognition
for Good Corporate Governance
1 National Award
Independent Chairperson
IND A1+ : Commercial Paper
D&B
5A2: Business Rating 1 National Award
for Excellence in Corporate Governance
2 times stood among the Top 25 Indian Corporates
adopting Good Corporate Governance Statutory Auditor Internal Auditor Technical Consultants Enterprise Resource Planning (ERP)
Corporate Presentation - May 2017 - Trident Ltd. 6
*Corporate Governance Report is available at www.tridentindia.com
Statutory Auditor
Deloitte
Haskins & Sells
Internal Auditor
KPMG
Consultants
Accenture
Planning (ERP)
SAP ECC 6
Bath Linen Bed Linen Yarn Paper
Barnala, Punjab 3 Units 388 Looms Budni, MP 1 Unit 300 Looms 48000 MT/pa Budni, MP 1 Unit 500 Looms 43.2 Mn Mtrs/pa Barnala, Punjab 5 Units 1.8 Lac Spindles Budni, MP 5 Units 3.7 Lac Spindles 2880 Rotors Barnala, Punjab 2 Units 175000 MT/pa 388 Looms 42000 MT/pa 1.8 Lac Spindles 3584 Rotors
Corporate Presentation - May 2017 - Trident Ltd. 7
Water Treatment
48 MLD 50 MW
Power
100000 TPA
Chemical
100% Cotton Yarn, Compact Yarn, Air- Rich, Zero Twist, Blended Yarn, Fancy Yarn, Melange, Specialty & others
Yarn Bath Linen Bed Linen
Solid & Printed Sheets, Top-Up Beds, Duvets, Comforters, Fitted Luxury, Organic, Spa & Hotel, Beach, Designer, Jacquard, Corporate Presentation - May 2017 - Trident Ltd. 8
Sheets, Pillow Cases, Quilts, Decorative pillows, Coverlets & others Dobby Texture, Celebratory, Bath Mats, Bathrobes, Checkered, Waffle, Infants & Kids and others
Home Textile
Bath Linen Manufacturing Processes Bed Linen Manufacturing Processes
Yarn
Automatic Bale Plucker Carding Draw Frame Combing TFO-Two for One Warping Sizing
Bath Linen Manufacturing Processes
Warping Weaving
Bed Linen Manufacturing Processes
Draw Frame Combing Ring Frame Speed Frame Weaving Greige Fabric Inspection Processed Fabric Processing Processing Processing Fabric Inspection Printing Spreading
Corporate Presentation - May 2017 - Trident Ltd. 9
Winding Real-time Monitoring Dispatch Dispatch Final Inspection & Packing Automated CSP Printing Automated CSP Dispatch
Value Addition
Focus on value added
Branding
Aggressive Branding Trusted Partner to the Top
Best Technology
Latest technology and
Global Markets
Focus on value added products to further improve contribution in the coming years Continuous Research, Innovation on fashion & high value products for premium customers Aggressive Branding Strategy to percolate Home Textile and Copier Products Launched an onshore design studio in New York with the larger showcase
Trusted Partner to the Top Global Retailers & Fashion Houses Adding Premium Customers Globally Presence in USA, UK, Italy, France, Japan, Latest technology and automation from global partners at all stages of manufacturing Vertically Integrated
premium customers
France, Japan, Australia and others
Corporate Presentation - May 2017 - Trident Ltd. 10
Textiles: A Dominant Industry
Employs 45 million people across the value chain;
Competitive Cost of Production
Competitive Labour, Power and Raw Material Cost;
Cotton Quality & Availability
Largest producer of cotton and still growing; Surplus available Employs 45 million people across the value chain; Strong Government support to industry
Favourable Government Policies
Focus on ‘Make In India’ and Competitive Labour, Power and Raw Material Cost; Access to advanced technology under Textile Upgradation Fund
still growing; Surplus available for export
Policies
Focus on ‘Make In India’ and Export Enhancement
Qualified & Skilled Manpower Global Friendly Environment
Corporate Presentation - May 2017 - Trident Ltd. 11
Qualified & Skilled Manpower
Large, young and talented workforce at a competitive though increasing cost
Global Friendly Environment
Stable democracy; comfort with global languages; Evolving practices in line with MNCs
Education & Welfare
Saakshar - Adult education; IL&FS partnership; 60k Students received 2 lacs notebooks across
Health
38k people got free medical consultation, tests & medicines; More than 350 free eye
Water & Energy Conservation
60k Students received 2 lacs notebooks across 200 schools; 40k flour sacks & pre owned belongings distributed across villages
Women Empowerment
Supporting over 100 sole earning women; 46% growth in tests & medicines; More than 350 free eye surgeries; Mobile dispensary to provide free primary health care
in the Conservation
Contribution towards Nirmal Narmada Project & Swachh Bharat; Received numerous awards in Energy Conservation earning women; 46% growth in female work force; 50+ women in leadership; 200+ women making marketable crafts products through training
the Service
Humanity
Corporate Presentation - May 2017 - Trident Ltd. 12 PHD Chamber Award for Outstanding Contribution to Social Welfare for 2016 National Award for Excellence in Energy Management from CII Golden Peacock Award for Environment Management Energy Conservation Award 2015-2016 received from IPMA and Ministry of Power
Biological Treatment of Waste Water
recycling
Washing process
Physio-chemical treatment of RO reject
Corporate Presentation - May 2017 - Trident Ltd. 13
Washing process
Northern Region ‘Export
Excellence Award’ in
‘Star Trading House-Non- MSME’ IPMA – Energy Conservation PMI India Project of the Year ASSOCHAM Leadership Award ‘Astitva Samman 2017’ PHD Chamber PHD Chamber- Outstanding Contribution Accredited with
‘Egyptian Gold Seal’
for Yarn, Terry Towel
& Bed Linen Products
1 2 National Energy Conservation Awards TEXPROCIL Export Performance Awards CII – Confederation of Indian Industry ‘Supplier Achievement in Excitement
MSME’ ‘Gold Trophy’ 2nd Set ‘Silver Trophy’ 1nd Set Conservation Award the Year ‘Large’ Category Award (CEO), 2016 PHD Chamber for women empowerment
15 4
Contribution to Social Welfare
& Bed Linen Products
from ‘Cotton Egypt
Association’
1 4 Wal-Mart Supplier of the Year awards 2 National Energy Conservation Awards Niryat Shree – FIEO Awards Punjab Safety Awards ‘Supplier Achievement in Excitement 2016’ Award from Sam’s Club USA ‘Best Quality Award 2016’ from SEARS HOLDING 1 1 1
Corporate Presentation - May 2017 - Trident Ltd. 14
2 JCPenney - Best Supplier, Innovation, Quality Awards Corporate Governance & CSR Awards IKEA Quality and Sustainability Awards D&B – ECGC: Exporter’s Excellence Awards 4 4 1
REVENUE EBIDTA PAT EVER HIGHEST REVENUE
EBIDTA
PAT
Interest Coverage Net Debt reduced by LT Debt under TUFS Interest Coverage
Net Debt reduced by
LT Debt under TUFS
Net Debt / Equity Net Worth Dividend Payout FY17
Corporate Presentation - May 2017 - Trident Ltd. 15
Net Debt / Equity
Net Worth
Dividend Payout FY17
Q4 FY17 FY17
REVENUE (INR CR) PAT (INR CR)
Q4 FY17 FY17
EBIDTA (INR CR)
+36%
Q4FY16: 978
FY16: 3744 +29%
REVENUE (INR CR) PAT (INR CR)
+64% Q4FY16: 61
FY16: 242 +39%
EPS (INR) Exports Mix % EBIDTA (INR CR)
+27% Q4FY16: 206
FY16: 763 +30%
EPS (INR)
+63% Q4FY16: 1.20
FY16: 4.76 +39%
Corporate Presentation - May 2017 - Trident Ltd. 16
Exports Mix %
Export 58% Domestic 42% Export 55% Domestic 45%
Q4FY17 FY17
as on March 31, 2017
NET DEBT (INR CR) LT DEBT (INR CR)
FY16: 3421
NET DEBT (INR CR) NET DEBT/EQUITY
FY16: 2529
LT DEBT (INR CR) NET DEBT/EBIDTA
FY17, including High Cost Debt of INR 227 Crore
FY17, including High Cost Debt of INR 68 Crore
NET DEBT/EQUITY
FY16: 1.4
CASH ACC. (INR CR) NET DEBT/EBIDTA
FY16: 4.5
TUFS DEBT (INR CR) Continuous Focus on Debt Repayment
3503 2852 3421 2714 Gross Debt (INR Cr.) Net Debt (INR Cr.)
Corporate Presentation - May 2017 - Trident Ltd. 17
CASH ACC. (INR CR)
FY16: 579
FY16: 1805
TUFS DEBT (INR CR)
2714 Mar'16 Mar'17
“The format for quarterly results as prescribed in SEBI circular CIR/CFD/CMD/15/2015 dated November 30,2015 has been modified to comply with the requirements of SEBI’s circular dated July 05, 2016 and schedule III (Division II) of Companies Act, 2013 applicable to companies that are required to comply with Ind AS. Act, 2013 applicable to companies that are required to comply with Ind AS.
Other Income
In line with recognition under Ind AS, Forex income was realized due to ever highest exports and significant rupee appreciation during Q4FY17, as against forward contracts, which were earlier recognised as other operating income. during Q4FY17, as against forward contracts, which were earlier recognised as other operating income.
Following balance sheet items have been impacted majorly in FY17 due to adoption of Ind AS & FY16 figures have been restated accordingly
term debt, which was earlier part of contingent liabilities
Corporate Presentation - May 2017 - Trident Ltd. 18
credited to the other equity.
Particulars Standalone Consolidated Year ended March 31,2016 Year ended March 31,2016 March 31,2016 March 31,2016
Total Equity under previous GAAP 1,74,165.8 1,77,889.6 Fair value of items of Property plant and equipment * 76,840.1 76,840.1 Redeemable preference shares classified as part of liabilities under Ind AS (6,000.0) (6,000.0) Shares held through Trust under amalgamation scheme with TAL reclassified to other equity (1,454.8) (1,454.8) Reciprocal interest in Group adjusted with Equity under Ind AS
Grant related to fixed assets classified as part of liabilities under Ind AS (5,048.5) (5,647.9) Grant related to fixed assets classified as part of liabilities under Ind AS (5,048.5) (5,647.9) Effect on account of reversal of Proposed Dividend 1,786.7 1,786.7 Impact of fair valuation of investments under Ind AS 1,026.6 1,026.6 Impact of measuring derivative instruments at fair value 776.7 776.7 Recognition of dividend on preference shares (218.0) (218.0) Other adjustments under Ind AS (243.9) (359.3) Deferred tax impact on Ind AS adjustments (69.2) (45.4)
Corporate Presentation - May 2017 - Trident Ltd. 19
Deferred tax impact on Ind AS adjustments (69.2) (45.4) Total adjustment to equity 67,395.7 65,720.4 Total Equity under Ind AS 2,41,561.5 2,43,610.0
“We are happy to showcase solid financial and operational performance for this
product offerings in the home textile space, helped us yield desired results. Going forward our focus remains on utilizing Bed and Bath capacities, generating free cash flow and improving our return ratios. There might be some headwinds pertaining to Currency Fluctuation and Global uncertainties, but overall we foresee buoyant times for our stakeholders as we strive to create value for them.”
Corporate Presentation - May 2017 - Trident Ltd. 20
Sales (INR Crores) EBITDA (INR Crores)
4839 20% 21% 22% 1400
EBITDA EBITDA %
3816 3744 4839 FY15 FY16 FY17 695 763 992 18% 20% 21% 16% 18% 20% 400 900 FY15 FY16 FY17
EBITDA %
EBIT (INR Crores) PAT (INR Crores)
10% 11% 12% 10% 15% 400 500 600
EBIT EBIT %
118 242 337
Corporate Presentation - May 2017 - Trident Ltd. 21
374 427 579 0% 5% 200 300 400 FY15 FY16 FY17 118 FY15 FY16 FY17
EPS (INR) Networth (INR Crores)
EPS
12%
Net Worth
2.3 4.8 6.6 8.6 11.4 14.7 FY15 FY16 FY17
EPS Cash EPS
2202 2416 2724 5% 10% 12% 0% 5% 10% 15% 1000 2000 3000 FY15 FY16 FY17*
Net Worth ROE
Net Block (INR Crores) Capital Employed (INR Crores)
3712 4693 4344
8% 7% 10% 10% 15% 20% 3000 4000 5000 6000 7000 Capital Employed ROCE
Corporate Presentation - May 2017 - Trident Ltd. 22
FY15 FY16 FY17
4853 5918 5576 0% 5% 10% 1000 2000 3000 FY15 FY16 FY17
Q4 FY17 Q4 FY16 Growth% Particulars (INR crore) FY17 FY16 Growth%
1330.1 978.2 36.0% Net Revenues 4839.3 3744.1 29.3%
1330.1 978.2 36.0% Net Revenues 4839.3 3744.1 29.3% 262.1 205.9 27.3% EBITDA 991.9 763.5 29.9% 19.7% 21.0%
EBITDA margin 20.5% 20.4% +10 bps 101.0 92.8 8.8% Depreciation 412.4 336.6 22.5% 161.1 113.1 42.4% EBIT 579.5 426.8 35.8% 12.1% 11.6% +50 bps EBIT margin 12.0% 11.4% +60 bps 32.1 36.4
Interest 141.0 145.2
129.0 76.7 68.2% Profit Before Tax 438.5 281.6 55.7%
Corporate Presentation - May 2017 - Trident Ltd. 23
99.7 60.9 63.6% Profit After Tax 337.0 242.3 39.1% 1.96 1.20 63.3% EPS (Diluted & non-annualized) (INR) 6.61 4.76 38.9%
Particulars (INR crore) As on Mar 31, 2017 As on Mar 31, 2016 Source of Funds Particulars (INR crore) As on Mar 31, 2017 As on Mar 31, 2016 Application of Funds Source of Funds
Equity 2724.50 2415.62
Equity Share Capital 509.58 509.37 Other Equity 2214.92 1906.25
Non-Current Liabilities 2006.78 2455.65
Financial Liabilities 1746.29 2196.50
Application of Funds
Non Current Assets 4645.53 4935.63
Property, Plant & Equipment 4307.42 4653.52 Capital Work-in-Progress 109.76 57.13 Intangible Assets 36.64 39.48 Intangible Assets under devp. 13.40 4.39 Financial Assets 106.37 91.23 Financial Liabilities 1746.29 2196.50 Provisions 14.04 8.46 Deferred Tax Liabilities 165.72 158.40 Other Non Current Liabilities 80.73 92.29
Current Liabilities 1421.48 1635.04
Financial Liabilities 1375.17 1591.73 Financial Assets 106.37 91.23 Other Non Current Assets 71.94 89.88
Current Assets 1507.23 1570.68
Inventories 768.25 898.50 Financial Assets
4.89 0.11
381.68 258.08
Corporate Presentation - May 2017 - Trident Ltd. 24
Financial Liabilities 1375.17 1591.73 Provisions 7.59 6.17 Other Current Liabilities 38.72 37.14
TOTAL 6152.76 6506.31
27.60 4.79
104.83 76.99
31.66 30.63
Other Current Assets 188.32 301.57
TOTAL 6152.76 6506.31
Bed Linen (In mn. meters)
Towel (In 000’ tons)
40% 41% 50% 50% 60% 150 200 29% 30% 40% 40 50
Project
90 90 90 40% 41% 20% 30% 40% 50 100 FY15 FY16 FY17 Installed Capacity Utilization 5.4 43.2 6% 0% 10% 20% 30% 10 20 30 40 FY16 FY17 Installed Capacity Utilization
Project commissioned at the end of FY16
Paper (In 000’ tons) Yarn (In 000’ tons)
101 101 101 88% 93% 93% 75% 80% 85% 90% 95% 50 100 150 200 175 175 175 87% 88% 89% 75% 80% 85% 90% 100 200 300
Corporate Presentation - May 2017 - Trident Ltd. 25
*Utilisation on tonnage basis
101 101 101 70% FY15 FY16 FY17 Installed Capacity Utilization 175 175 175 70% FY15 FY16 FY17 Installed Capacity Utilization
Dividend Payout Ratio
Minimum Annual Dividend Maximum Annual Dividend
29% 23% 27%
Dividend
Dividend
(Including Dividend Distribution Tax)
23% 27%
FY15 FY16 FY17
Year Total Dividend% Dividend Type %age
Historical Dividends (%age of Face Value)
6% 9% 15%
Year Dividend% Dividend Type %age
FY17
15%
Final 3% Interim 6% Interim 6%
FY16
9%
Interim 3% Interim 3% Corporate Presentation - May 2017 - Trident Ltd. 26
*Dividend Distribution Policy is available at www.tridentindia.com
6% 9%
FY15 FY16 FY17
9%
Final 3%
FY15
6%
Interim 3% Interim 3%
Bed & Bath Yarn Paper
Export (%) Revenue Q4FY17 Export (%) Revenue Q4FY17
88% 12%
Export % Domestic %
38%
62% 7% 93% 88% 93%
Export (%) Revenue FY17
11%
Export % Domestic %
32%
9%
Corporate Presentation - May 2017 - Trident Ltd. 27
89% 68% 91%
Corporate Presentation - May 2017 - Trident Ltd. 28
ETHIOPIAN GOVERNMENT
Corporate Presentation - May 2017 - Trident Ltd. 29
Corporate Presentation - May 2017 - Trident Ltd. 30
Segmental Revenue:
49% 33% 18% FY17 28% 28% 42% 46% 50% 51% 37% 32% 22% 22% 22% 22% FY13 FY14 FY15 FY16
28% 50% 22% FY13 Bed & Bath Linen Yarn Paper
Corporate Presentation - May 2017 - Trident Ltd. 31
Global Home Textile Market Global Home Textiles Market valued at
60.8 26.4 17.6 15.4 11.2
Global Home Textile Market Size 2020(E) ($ bn) Global Home Textiles Market valued at $104.2 billion in 2013; is expected to witness a growth of 3.5% between 2015 and 2020 to reach $131.5 billion by 2020. Bed Linen & Bed Spread Segment accounting for the largest market share of
60.8 26.4 17.6 15.4 11.2
Bed & Bath Linen Market Size ($ bn)
Bed Linen & Bed Spread Bath / Toilet Linen Floor Upholstery Kitchen Linen
accounting for the largest market share of 43.9% in 2014 is expected to grow at CAGR of 4.4% between 2015 and 2020 to reach $60.8 billion by 2020 from $48.9 billion in 2015. Bath / Toilet Linen accounting for the second largest market share is expected to
47.1 21.6 60.8 26.4 2014 2020(E)
CAGR 4.4% CAGR 3.5%
Bed & Bath Linen Market Size ($ bn)
Corporate Presentation - May 2017 - Trident Ltd. 32
second largest market share is expected to grow at a second fastest growth rate of 3.5% after Bed Linen & Bedspread and is expected to reach at $26.4 billion by 2020 representing 20.1% market share.
21.6 Bed Linen & Bed Spread Bath / Toilet Linen
Source: Global Home Textiles Market Outlook, Fibre2Fashion
India’s export share in the US towel market has improved at a
35% 36% 38% 40% 42%
Market Share in US Towel Market has improved at a rampant pace from 30% in 2009 to 42% till March 2017
30% 35% 36% 23% 25% 26% 25% 23% 24% 22% 24% 23% 22% 22% 19% 25% 16% 15% 15% 15% 15% 2009 2011 2013 2015 2016 Q1-2017 India China Pakistan ROW
The US bedsheet market has been largely dominated by Indian exports
India China Pakistan ROW 26% 38% 46% 48% 49% 53% 29% 23% 24% 23% 22% 20% 26% 23% 18% 17% 16% 15% 19% 16% 12% 12% 14% 12%
Market Share in US Sheet Market
Corporate Presentation - May 2017 - Trident Ltd. 33
Indian exports
Source: Otexa
16% 15% 16% 12% 12% 14% 12% 2009 2011 2013 2015 2016 Q1-2017 India China Pakistan ROW
Indian Home Textile Market India represents 3rd largest market share
3.3 0.9 0.3 0.9 0.2
Indian Home Textile Market Size 2020(E) ($ bn) India represents 3 largest market share in Asia-Pacific home textiles market. Home textiles spending in India is estimated at $3.7 bn in 2014 and is expected to grow fastest in world at CAGR of 7.2% between 2015 & 2020 to reach $5.6 bn by 2020. Bed Linen & Bed Spread accounted for 58.1% of the Indian home textiles market
3.3 0.9 0.3 0.9 0.2
Indian Bed & Bath Linen Market Size ($ bn)
Bed Linen & Bed Spread Bath / Toilet Linen Floor Upholstery Kitchen Linen
58.1% of the Indian home textiles market worth $2.1 billion in 2014 and is expected to witness highest growth between 2015 and 2020 to reach $3.3 billion growing at a CAGR of 7.4% during the period. Bath / Toilet Linen which represented 2nd largest market share is expected to follow
2.1 0.6 3.3 0.9 2014 2020(E)
CAGR 7.4% CAGR 6.9%
Indian Bed & Bath Linen Market Size ($ bn)
Corporate Presentation - May 2017 - Trident Ltd. 34
largest market share is expected to follow bed linen & bed spread in terms of growth rate and is set to register a CAGR of 6.9% during the period of study to reach $ 0.9 billion by 2020.
0.6 0.9 Bed Linen & Bed Spread Bath / Toilet Linen
Source: Global Home Textiles Market Outlook, Fibre2Fashion
Sales (INR Crores) EBITDA (INR Crores)
3864 18% 25% 800 +34% +27% +32% 753 1056 2880 3864 Q4 FY16 Q4 FY17 FY16 FY17 142 180 523 690 19% 17% 18% 18% 5% 10% 15% 20% 25% 200 400 600 800 Q4 FY16 Q4 FY17 FY16 FY17
EBITDA EBITDA %
+40% 10% 10% 10% 9% 10% 15% 20% 200 300 400
EBIT (INR Crores)
EBITDA EBITDA %
Trident’s Market Share rising in Towel Export to US 10%
CY14
13%
CY16
28%
CY14
32%
CY16
+42% +30%
Corporate Presentation - May 2017 - Trident Ltd. 35
73 104 279 364 0% 5% 10% 100 200 Q4 FY16 Q4 FY17 FY16 FY17
EBIT EBIT % *Home Textile figures includes Yarn also
Trident’s Share in Global Towel Export to US
CY14 CY16
Trident’s Share in Indian Towel Export to US
CY14 CY16
Corporate Presentation - May 2017 - Trident Ltd. 36
Super Soft Moisture Wicking All Season Sheet Superior Softness Breathable Bio Softness Renewable Reduced Carbon Wicking Breathable Luxury Sleep Comfort Superior Cotton Yarn Feather Soft Sheet Breathable Moisture Wicking Dry Comfort Durable Compact Yarn Quick Dry Super Soft Reduced Carbon Foot Print Natural Finish
Corporate Presentation - May 2017 - Trident Ltd. 37
Sheet Enhanced Lustre & Vibrant Shades Everlasting Touch Superior Softness Super Soft Moisture Management Breathable
16.51 17.42 16.63
) Consumption Production
Indian Paper Industry
Accounts for 3% of World’s Paper Production Turnover of INR 500 billion approximately
Demand Supply Dynamics 16.51 17.42 14.49 16.63
FY14 FY15 (Million Tonnes)
Turnover of INR 500 billion approximately Contribution to exchequer is INR ~45 billion Total production grew at CAGR 13.3% during FY11-15 Total production at 16.63~ million tonnes at the end of FY15 Employs > 0.5 mn. people directly and 1.5 mn. people indirectly
Increase in Literacy Rate Paper consumption to grow by an average annual growth rate of 8%-10% during FY16-19
Raw Material
Paper Board & Newsprint
18%
Speciality
4%
Paper
Waste Paper or Agro (Bagasse, Wheat Straw)
11% Demand Drivers
Increase in Literacy Rate
2001 : 65% 2011 : 74%
Increasing No. of Regd. Publications rate of 8%-10% during FY16-19 Domestic production remains insufficient to meet the growing demand
100% FDI Zero Import duty on machinery Spending Rs 280 bn on Education; Proposed to Open 62 Navodaya Vidyalya over next 2 yrs
Increase in Corporate Activity & e-commerce Corporate Presentation - May 2017 - Trident Ltd. 38
Raw Material used to Manufacture Paper
Board & Packing
46%
Printing & Writing
32%
Paper Consumption in India
Paper or Recycle Fiber
65%
Wood / Bamboo
24%
Publications
(Newspapers & Other periodicals) 2009 – 73,146 2015 – 1,05,443
Source : Dun & Bradstreet – Sector Watch Report on Indian Paper Industry
Activity & e-commerce Increase demand for Packaging Products
Sales (INR Crores) EBITDA (INR Crores)
831 872 35% 400 +5% +28% +26% 218 225 831 872 Q4 FY16 Q4 FY17 FY16 FY17 64 82 240 302 29% 36% 29% 35% 5% 15% 25% 35% 45% 100 200 300 400 Q4 FY16 Q4 FY17 FY16 FY17
EBIDTA EBIDTA %
+3%
EBIT (INR Crores)
EBIDTA EBIDTA %
19% 25% 18% 25% 40% 60% 150 200 250
Enhanced Margin due to higher traction in Copier Paper
+39% +46% 52%
Copier Paper Sales Volume
Corporate Presentation - May 2017 - Trident Ltd. 39
41 57 148 216 19% 25% 18% 0% 20% 40% 50 100 150 Q4 FY16 Q4 FY17 FY16 FY17
EBIT EBIT %
45% 47% FY13 FY15 FY17
Eco Friendly Wheat Straw based Paper High Quality
72 GSM 86% Brightness 75 GSM 88% Brightness 100 GSM 92% Brightness
High Quality Jam Free
75 GSM 90% Brightness 86% Brightness 88% Brightness 70 GSM 87% Brightness 80 GSM 90% Brightness 92% Brightness
Corporate Presentation - May 2017 - Trident Ltd. 40
Farmer earns extra income for each kg of wheat straw sold to Trident With Production Capacity of 450 TPD, Trident saves 8100 trees everyday 5520 lbs of CO2 emissions reduced per 1000 reams of Paper produced
For more information about us, please visit www.tridentindia.com Pawan Jain / Vipul Garg Investor Relations, Trident Ltd. Investor Relations, Trident Ltd.
Tel: +91 161 5039 999 Fax: +91 161 5039 900 Email: pawanjain@tridentindia.com, vipulgarg@tridentindia.com Corporate Presentation - May 2017 - Trident Ltd. 41