DETECTION OF IMPACT LOCATIONS FOR A COMPOSITE WING BOX UNDER BENDING - - PDF document

detection of impact locations for a composite wing box
SMART_READER_LITE
LIVE PREVIEW

DETECTION OF IMPACT LOCATIONS FOR A COMPOSITE WING BOX UNDER BENDING - - PDF document

18 TH INTERNATIONAL CONFERENCE ON COMPOSITE MATERIALS DETECTION OF IMPACT LOCATIONS FOR A COMPOSITE WING BOX UNDER BENDING LOADS B. W. Jang 1 , Y. G. Lee 1 , J. H. Kim 1 , Y. Y. Kim 1 , C. G. Kim 1 *, C. Y. Park 2 1 School of Mechanical, Aerospace


slide-1
SLIDE 1

18TH INTERNATIONAL CONFERENCE ON COMPOSITE MATERIALS

1 Introduction The use of composite materials in the aerospace industries is gradually increasing thanks to their excellent merits such as high specific strength and stiffness, excellent corrosion resistance. However, in

  • rder to increase their portions as primary materials,

higher reliability is required because their various and complex damage modes [1]. Moreover, their mechanical behaviors after damages are hard to be

  • predicted. Due to these reasons, concepts of

structural health monitoring (SHM) have been studied to enhance reliability and safety. Furthermore, structural data from built-in sensor system are useful for efficient inspection and maintenance of composite structures [2]. Above all, impact monitoring including impact location detection and damage assessment is indispensable because composite materials are susceptible to impact damages [3]. Moreover, most of impact induced damages are hidden inside the laminates or

  • ccur on the opposite surface. Thus, detection of

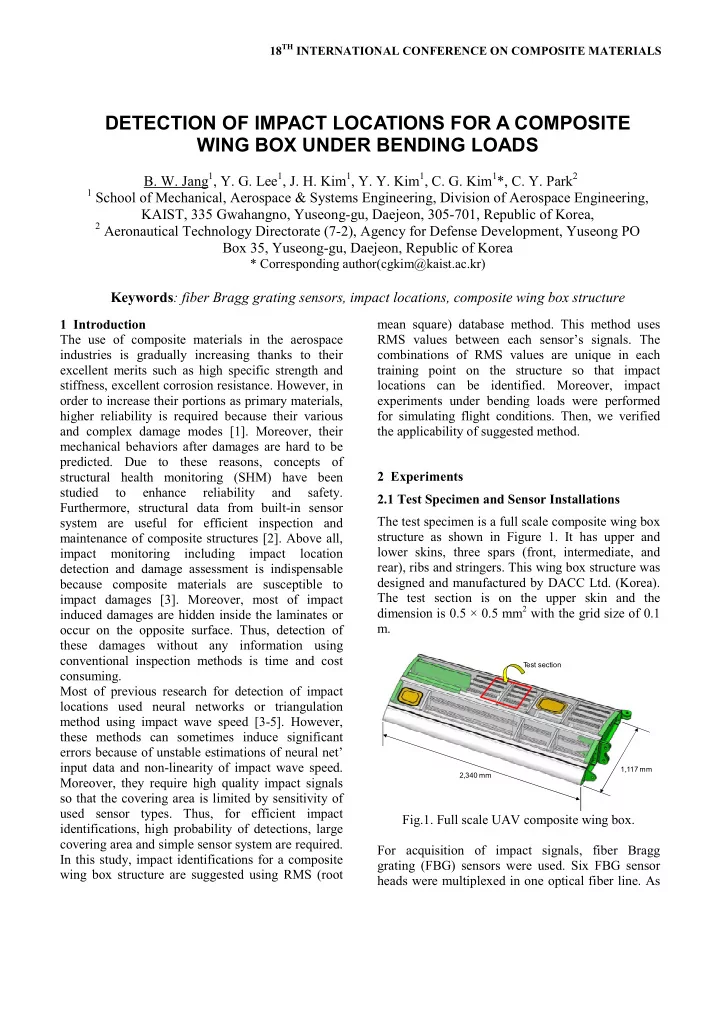
these damages without any information using conventional inspection methods is time and cost consuming. Most of previous research for detection of impact locations used neural networks or triangulation method using impact wave speed [3-5]. However, these methods can sometimes induce significant errors because of unstable estimations of neural net’ input data and non-linearity of impact wave speed. Moreover, they require high quality impact signals so that the covering area is limited by sensitivity of used sensor types. Thus, for efficient impact identifications, high probability of detections, large covering area and simple sensor system are required. In this study, impact identifications for a composite wing box structure are suggested using RMS (root mean square) database method. This method uses RMS values between each sensor’s signals. The combinations of RMS values are unique in each training point on the structure so that impact locations can be identified. Moreover, impact experiments under bending loads were performed for simulating flight conditions. Then, we verified the applicability of suggested method. 2 Experiments 2.1 Test Specimen and Sensor Installations The test specimen is a full scale composite wing box structure as shown in Figure 1. It has upper and lower skins, three spars (front, intermediate, and rear), ribs and stringers. This wing box structure was designed and manufactured by DACC Ltd. (Korea). The test section is on the upper skin and the dimension is 0.5 × 0.5 mm2 with the grid size of 0.1 m.

2,340 mm 1,117 mm T est section

Fig.1. Full scale UAV composite wing box. For acquisition of impact signals, fiber Bragg grating (FBG) sensors were used. Six FBG sensor heads were multiplexed in one optical fiber line. As

DETECTION OF IMPACT LOCATIONS FOR A COMPOSITE WING BOX UNDER BENDING LOADS

  • B. W. Jang1, Y. G. Lee1, J. H. Kim1, Y. Y. Kim1, C. G. Kim1*, C. Y. Park2

1 School of Mechanical, Aerospace & Systems Engineering, Division of Aerospace Engineering,

KAIST, 335 Gwahangno, Yuseong-gu, Daejeon, 305-701, Republic of Korea,

2 Aeronautical Technology Directorate (7-2), Agency for Defense Development, Yuseong PO

Box 35, Yuseong-gu, Daejeon, Republic of Korea

* Corresponding author(cgkim@kaist.ac.kr)

Keywords: fiber Bragg grating sensors, impact locations, composite wing box structure

slide-2
SLIDE 2

depicted in Figure 2, each FBG sensor was attached

  • n the inner surface of test section.

FBG 1 FBG 2 FBG 3 FBG 6 FBG 5 FBG 4

0.0 0.1 0.2 0.3 0.4 0.5 0.0 0.1 0.2 0.3 0.4 0.5

Y (m) X (m)

FBG 6 FBG 5 FBG 4 FBG 1 FBG 2 FBG 3

Fig.2. Test section and sensor locations. 2.2 High-speed FBG Interrogator To acquire a FBG sensor signal at a sampling frequency of 100 kHz in multiplexing, a newly- developed high-speed FBG interrogation system (SFI-710, Fiberpro Inc., Korea) was adopted. Using this commercial FBG interrogation system, more applicable impact identification techniques could be realized. 2.3 Low-velocity Impact Experiments In this study, in order to give the low-velocity impact without dual impacts, an instrumented impact test fixture was used. The low-velocity impacts were given on the grid points (32 points) in the test

  • section. To make loading conditions, up and down

bending loads were applied to the wing box tip

  • positions. Thus, the loading conditions are unloading,

up and down bending. Low-velocity impact tests were performed in each loading case. The impact energy was 2 J in order to prevent impact damage

  • ccurrences. Due to the curvature of wing skin, the

impact test fixture was tilted as shown in Figure 3.

Curved surface

Fig.3. Experimental set up. 3 Impact identifications 3.1 Construction of RMS database Figure 4 shows the FBG sensor signals in case of impact on (2, 2) point. Using the acquired signals in the unloading case, the database was constructed for each grid point. In this database, there are twelve values calculated from the FBG sensor signals.

0.00 0.01 0.02 0.03 0.04 0.0 0.2 0.4 0.6 0.8 1.0 1.2 1.4 1.6

FBG 6 FBG 5 FBG 4 FBG 3 FBG 2 Wavelength shift (nm) Time (sec) FBG 1

Fig.4. FBG sensor signals. Firstly, six RMS values between each sensor signal were calculated (R12, R23, R34, R45, R56 and R61).

slide-3
SLIDE 3

3 PAPER TITLE

These numbers between one and six mean the FBG sensor number. Secondly, six integration values of each sensor’ normalized signal were obtained (I1, I2, I3, I4, I5 and I6). For calculating of these integrations, absolute values were used. Because the number of grid points is thirty two, there are thirty two sets of RMS and integration values in the database. Once an impact signal is acquired, the RMS and integration values are immediately calculated. Then, by comparing these values and database, an impact location could be detected. Figure 5 shows the flow chart of this RMS database method.

Data acquisitions Baseline converting Arrival time detection Subtracted data from arrival time RMS values Integration values Comparison from database Location detection

Fig.5. Flow chart for impact identifications using RMS database method. 3.2 Results of Impact Localizations In cases of unloading and bending loadings, impact identifications were performed using RMS database

  • method. As a result, impact locations in all loading

cases were successfully detected. From this result, it can be concluded that the suggested RMS database method has robustness to static loading conditions. Then, in case of the non-grid points (no database locations), the grid points around each non-grid point were detected, because the detected locations are always on the grid points using this method. It means that the detecting accuracy is determined by the number and size of grids in the test section. Thus, in order to detect the impact location more precisely, additional database are required on other regions in the test section. The detected impact locations on the non-grid points were shown in Figure 6.

0.0 0.1 0.2 0.3 0.4 0.5 0.0 0.1 0.2 0.3 0.4 0.5

Unloading

Point 1 Point 2 Point 3

0.0 0.1 0.2 0.3 0.4 0.5 0.0 0.1 0.2 0.3 0.4 0.5

Up-bending

Point 1 Point 2 Point 3

0.0 0.1 0.2 0.3 0.4 0.5 0.0 0.1 0.2 0.3 0.4 0.5

Down-bending

Point 1 Point 2 Point 3

Fig.6. Detected impact locations on the non-grid points in all loading cases.

slide-4
SLIDE 4

3.3 Discussions In this study, we suggested new impact localization method using relations between sensors’ signals. The principle of this method is based on the uniqueness of sensors’ relations dependent on each

  • location. As a result, the impact locations on the grid

points were correctly detected in both of unloading and bending loading cases. However, as shown in Figure 6, there are relatively large errors in the detected results of point 3 in the bending loads. It can be thought that the causes of these errors are insufficient number and inappropriate locations of the grid points. If sensors’ relations on point 3 are added to the RMS database, the impact location can be successfully identified. Moreover, if the locations

  • f grid points are carefully determined from

considerations of target structure’ characteristics, the results of non-grid points can be better. Even if doubt remains about the results of non-grid points, it is clear that this suggested method shows the possibility of impact identifications for large scale composite structures. 4 Conclusions From the low velocity impact experiments on a full scale composite wing box structure, an impact identification method using the RMS database as a training data set was suggested and verified. Also, the applicability of this method to static loading cases was validated. Although more research is needed to determine the appropriate locations and

  • ptimal number of grid points, this present study can
  • ffer an effective approach to impact localization

problems for real composite structures. Acknowledgements This work was supported by the Defense Acquisition Program Administration and the Agency for Defense Development under contract UC080019JD. References

[1] J. H. Lee and C. S. Hong “Refined two-dimensional analysis of cross-ply laminates with transverse cracks based on the assumed crack opening deformation”. Composites Science and Technology, Vol. 46, pp 157-166, 1993. [2] R. M. Measures “Structural monitoring with fiber

  • ptic technology”. Academic Press, 2001.

[3] D. U. Sung, J. H. Oh, C. G. Kim and C. S. Hong “Impact monitoring of smart composite laminates using neural networks and wavelet analysis”. Journal

  • f Intelligent Material System and Structures, Vol. 11,

pp 180-190, 2000. [4] W. B. Spillman and P. L. Fuhr “Impact detection and location system for smart skins applications”. Proceeding of SPIE, Vol. 2370, pp 308-315, 1990. [5] J. R. LeClerc, K. Worden and W. J. Staszewski “Impact detection in an aircraft composite panel – A neural-network approach”. Journal of Sound and Vibration, Vol. 299, No. 3, pp 672-682, 2007.