
SLIDE 1
1
Design of Digital Logic by Genetic Regulatory Networks
Ron Weiss Department of Electrical Engineering Princeton University
Computing Beyond Silicon Summer School, Caltech, Summer 2002
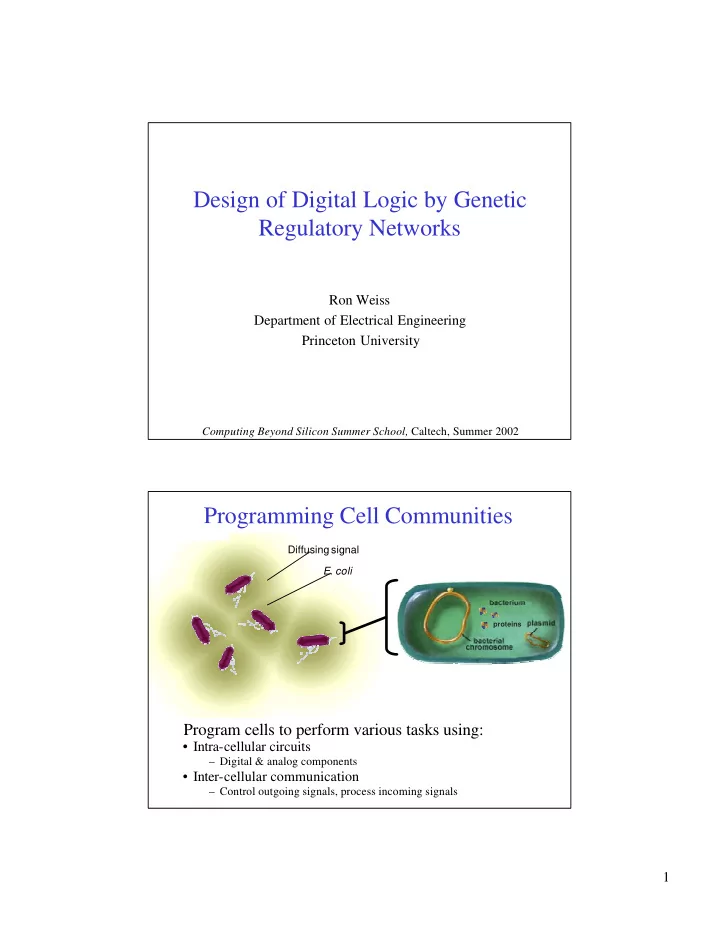
- E. coli
Diffusing signal
Programming Cell Communities
proteins
Program cells to perform various tasks using:
- Intra-cellular circuits
– Digital & analog components
- Inter-cellular communication
– Control outgoing signals, process incoming signals