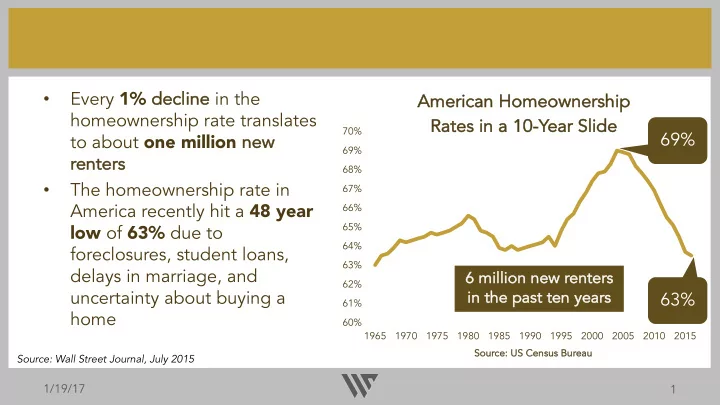
decline in the
play

decline in the Americ ican Homeownership ip homeownership rate - PowerPoint PPT Presentation

Every 1% de decline in the Americ ican Homeownership ip homeownership rate translates Rates in in a 10-Year Slid lide 70% 69% to about one million new new 69% re renters 68% The homeownership rate in 67% America recently


  1. Every 1% de decline in the • Americ ican Homeownership ip homeownership rate translates Rates in in a 10-Year Slid lide 70% 69% to about one million new new 69% re renters 68% The homeownership rate in • 67% America recently hit a 48 year 66% low of 63% due to 65% 64% foreclosures, student loans, 63% delays in marriage, and 6 6 million n new new rent enter ers 62% uncertainty about buying a in in the past ten ye years 63% 61% home 60% 1965 1970 1975 1980 1985 1990 1995 2000 2005 2010 2015 Source: US Census Bureau Source: US Census Bureau Source: Wall Street Journal, July 2015 1/19/17 1

  2. Serio ious Delin linquency Rates Freddie Mac single-family • Mu Mult ltif ifamily ily vs. Sin ingle le-Family ily Lo Loans, 2005-2015 2015 loans peaked at 4.0% Freddie Mac Multifamily Loans Freddie Mac Single Family Loans while delinquency for 4.50% multifamily loans hovered 4.00% around 0.4% 3.50% 3.00% Multifamily delinquency • 2.50% rate…at its peak…was 2.00% 90% lower than the 1.50% 1.00% residential rate in the worst 0.50% downturn since the Great 0.00% Depression 2005 2006 2007 2008 2009 2010 2011 2012 2013 2014 2015 Sources: Fannie Mae, Freddie Mac and Urban Institute. Note: Multifamily serious delinquency rate is the unpaid balance of loans 60 days or more past due, divided by the total unpaid balance 1/19/17 2

  3. DEMOGRAPHICS ARE DRIVING MULTIFAMILY HOUSING DEMAND US Regis istered Bir Births 1933-2004 2004 Both baby boomers ( 77 million ) and echo Post WWII Ba Baby Bo Boom Echo Ba Baby Bo Boom 4,500,000 boomers ( 80 million ) 4,000,000 are flocking to rental 3,500,000 3,000,000 housing 2,500,000 2,000,000 1,500,000 1,000,000 500,000 0 from 1932-2004 (in years) from 1932 2004 (in years) Source: US Census Bureau 1/19/17 3

  4. THE MAJORITY OF ECHO BOOMERS RENTING Echo boomers Renter Household lds by Quarter • (in millio (in illions) are the nation’s 44.0 largest 42.0 demographic 40.0 group 38.0 ~ 54% are renting • 36.0 34.0 32.0 2002 2003 2004 2005 2006 2007 2008 2009 2010 2011 2012 2013 2014 2015 2016 Source: Chandan, US Census Bureau 1/19/17 4

  5. FAVORABLE IMMIGRATION TRENDS • US immigration Demographic ic Shif ift due to Ma Mass continues to Immig igratio ion grow (in millions) Growth Caused by Post- 1970 Immigration 450 • US immigrants, Growth from Population 400 Already in US, 1970 rent more often 350 300 than they own, 250 200 and rent for 150 longer periods 100 50 of time 0 1970 1980 1990 2000 2010 2020 2030 2040 2050 Source: 37 th Parallel Properties (37parallel.com) 1/19/17 5

  6. THE RECIPE 1/19/17 6

Download Presentation
Download Policy: The content available on the website is offered to you 'AS IS' for your personal information and use only. It cannot be commercialized, licensed, or distributed on other websites without prior consent from the author. To download a presentation, simply click this link. If you encounter any difficulties during the download process, it's possible that the publisher has removed the file from their server.

Recommend


More recommend