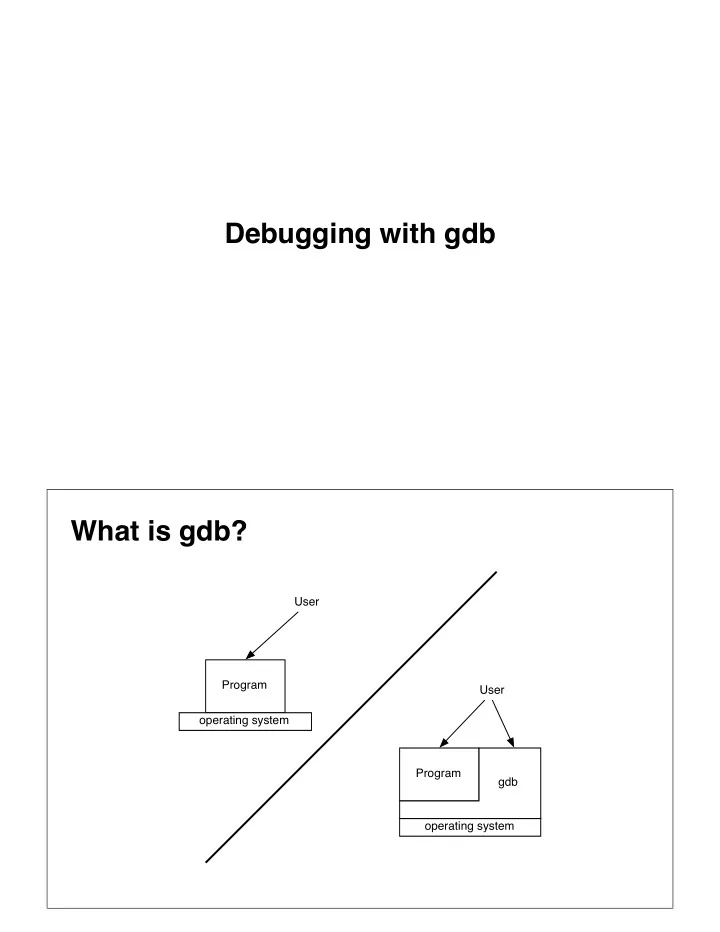
SLIDE 1 Debugging with gdb What is gdb?
Program
User Program
User gdb
SLIDE 2 Starting gdb
% cc -g ... -o myprogram % gdb myprogram (gdb) run -some -startup flags % gdb myprogram (gdb) attach 2342 % ls ~/.gdbinit
Backtraces
(gdb) where #0 -[LectureNotes initWithDictionary:name:] (self=0xead68, _cmd=0x6e40, dict=0x14b5150, x=0x14b8ef0) at LectureNotes.m:6 #1 0x901c04d0 in parseTag () ... #7 0x9018f044 in CFXMLParserParse () #8 0x000eb2dc in BigParse (xmlData=0x6e40) at BigParse.m:171 #9 0x00004320 in -[MyDocument loadFileWrapperRepresentation:ofType:] (self=0x22e170, _cmd=0x6e40, wrapper=0x14a3470, type=0x14b8ef0) at MyDocument.m:54 #10 0x93281210 in -[NSDocument readFromFile:ofType:] () #11 0x931c505c in -[NSDocument initWithContentsOfFile:ofType:] () ... #22 0x9308dbfc in _DPSNextEvent () #24 0x930b15e4 in -[NSApplication run] () #25 0x9315f6b8 in NSApplicationMain () #26 0x00003f20 in _start (argc=1, argv=0xbffffa00, envp=0xbffffa08) at /SourceCache/Csu/Csu-45/crt.c:267
SLIDE 3
Breakpoints
(gdb) break main Breakpoint 1 at 0x38dc: file main.m, line 5. (gdb) break -[LectureNotes initWithDictionary: name:] Breakpoint 2 at 0x4ed0: file LectureNotes.m, line 6. (gdb) break LectureNotes.m:6 Note: breakpoint 2 also set at pc 0x4ed0. Breakpoint 3 at 0x4ed0: file LectureNotes.m, line 6. (gdb) break LectureNotes::WalkParseTree Breakpoint 4 at 0xdfed0: file ParseTree.cpp, line 6. (gdb) rbreak .*printf.* (sets a couple dozen breakpoints) (gdb) fb -[NSException raise] Breakpoint 5 at 0x0 (gdb) info breakpoints
Commands on Breakpoints
(gdb) break walkTreePostorder Breakpoint 2 at 0x1d80: file treefunc.c, line 6 (gdb) commands 2 Type commands for when breakpoint 2 is hit, one per line. End with a line saying just "end". >where >print node >continue >end
SLIDE 4
Conditional breakpoints
(gdb) break memerror.m:74 if argc != 2 (gbd) cond 2 (argc != 2) (gdb) ignore 3 50
Resuming execution
(gdb) continue (gdb) step (gdb) next (gdb) return (gdb) until
SLIDE 5
Displaying data
(gdb) print i $1 = 17263812 (gdb) print/x i $2 = 0x1076cc4 (gdb) print/t i $3 = 1000001110110110011000100 (gdb) print *node->next $5 = { theChar = 98 'b', next = 0x0 } (gdb) set node->next->thechar = 'q'
Displaying arrays
int imsg[] = {78, 111, 119, 32, 72, 105, 114, 105, 110, 103, 0}; (gdb) (gdb) print {int} imsg @ 10 $2 = {78, 111, 119, 32, 72, 105, 114, 105, 110, 103} (gdb) print {int}(imsg + 3)@2 $3 = {32, 72} (gdb) print/c {int} imsg @ 10 $4 = {78 'N', 111 'o', 119 'w', 32 ' ', 72 'H', 105 'i', 114 'r', 105 'i', 110 'n', 103 'g'}
SLIDE 6
Getting information
(gdb) help (gdb) info breakpoints (gdb) info args (gdb) info locals (gdb) info catch (gdb) info classes (gdb) info selectors
core files
% limit coredumpsize unlimited struct rlimit rl; rl.rlim_cur = RLIM_INFINITY; rl.rlim_max = RLIM_INFINITY; if (setrlimit (RLIMIT_CORE, &rl) == -1) { fprintf (stderr, "error in setrlimit for RLIMIT_CORE: %d (%s)\n", errno, strerror(errno)); }
SLIDE 7 gdb front-ends
- gdb command line
- emacs gud
- GLUE : Gdb Like Under Emacs / dbvi
- GNU ddd - the Data Display Debugger
- Mac OS X Project Builder / XCode
Random Resources
- gdb quick reference card at http://refcards.com
- MacEdition has a basic introduction
- Core Mac OS X and Unix Programming book
- GNU gdb documentation
SLIDE 8 Demo Debugging Techniques
- Bugs vs. Defects
- Don’t get too debugger happy
- C / C++ need debuggers more than other languages
- Explain the problem to someone or something
- Code smells
- Keep a log
SLIDE 9 Get the Mindset
The Universal Troubleshooting Process (by Steve Litt)
- Get the Attitude
- Make a damage control pla
- Get a complete and accurate symptom description
- Reproduce the symptom
- Do appropriate general mainteanace
- Narrow it down to the root cause
- Repair or replace the defective component
- Test
- Take pride in your solution
- Prevent future occurrences of this problem
Write code with debugging in mind
Objective-C version
[[document objectAtIndex: [tableView selectedRow]] setFont: [[NSUserDefaults standardDefaults] labelFont]] int selectedRow; selectedRow = [tableView selectedRow]; Paragraph *paragraph; paragraph = [document objectAtIndex: selectedRow]; Font *labelFont; labelFont = [[NSUserDefaults standardDefaults] labelFont]; [paragraph setFont: labelFont];
SLIDE 10 Write code with debugging in mind
C++ version
document->GetParagraph(tableView->selectedRow())-> setFont(UserDefaults->StandardDefaults()->labelFont); int selectedRow; selectedRow = tableView->selectedRow(); Paragraph *paragraph; paragraph = document->GetParagraph(selectedRow); Font *labelFont; labelFont = UserDefaults->StandardDefaults()->labelFont(); paragraph->setFont (labelFont);
Tracking down problems
- Crashers are great
- If it’s reproducible, it’s dead
- If not, don’t give up
- Camp on the problem
- Binary search in
- Don’t be afraid to change code
- Be consistent with your test data
SLIDE 11 Debugger Techniques
- Caveman debugging
- Be aware of your debugger’s features
- gdb for code exploration
- Stochastic profiling
- Single-stepping through brand new code
War Stories
SLIDE 12 Looking Glass on SunView
Window
/dev/wnd05
Window
/dev/wnd08
Window
/dev/wndC3
event queue event queue event queue Application
large static site
HP Server HP Server HP Server HP Server HP Server HP Server Load balancer
SLIDE 13 Ad Server
Threaded webserver search plug-in Lycos / Yahoo UDP driver keyword matching ad plug-in proprietary host-side rotation logic Digital Unix Digital Unix Digital Unix Digital Unix
. . .
Load Balancer