
SLIDE 1
De Development of
- f MASH Co
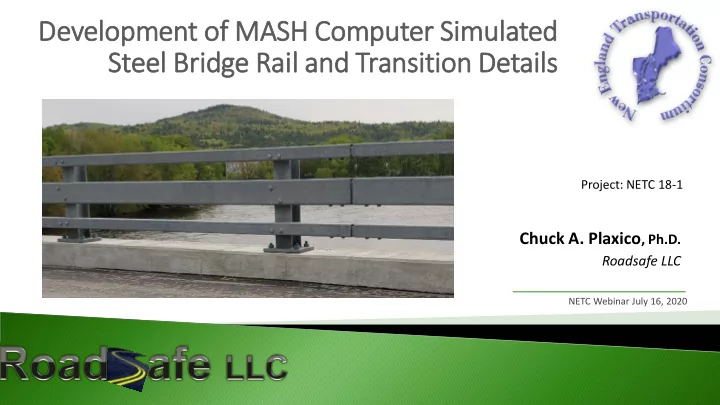
Computer Sim imulated Steel Bri Bridge Rail il and Transition De Details
Chuck A. Plaxico, Ph.D.
Roadsafe LLC
NETC Webinar July 16, 2020
Project: NETC 18-1
De Development of of MASH Co Computer Sim imulated Steel Bri - - PowerPoint PPT Presentation
De Development of of MASH Co Computer Sim imulated Steel Bri Bridge Rail il and Transition De Details Project: NETC 18-1 Chuck A. Plaxico , Ph.D. Roadsafe LLC NETC Webinar July 16, 2020 Background and Project Motivation The current
Chuck A. Plaxico, Ph.D.
Roadsafe LLC
NETC Webinar July 16, 2020
Project: NETC 18-1
installed on federal-aid projects requires upgrading non-conforming systems to MASH acceptance level for situations involving full system replacements, certain structural rehabilitations (e.g., deck replacements), or repairing a critically damaged bridge rail system.
guardrail transition (AGT) systems used in the New England states, include details for 2-bar, 3- bar and 4-bar designs, which were developed and tested under prior crash testing and evaluation standards.
Transportation Agencies to determine if these existing NETC designs meet the strength and safety criteria of the current test standard (i.e., MASH), which involve higher impact severities than the previous crash testing standards.
Slide 3
AGT designs to:
1) Determine preliminary MASH compliance/equivalency:
(395)
2) Determine the least conservative designs for further evaluation using FEA crash simulation.
these systems using finite element analysis (FEA) computer simulation using MASH test conditions and criteria:
Slight variations in design details depending
W6x25 8’ (spacing) 7”or 9” 12”x10”x1” Baseplate Four 1” Dia. A449 Anchor Bolts ¾” Dia. A325 Rail Splice 1.5’ HSS 4 x 4 x ¼ HSS 8 x 4 x 5/16
9.5” 7” 11.5” 12”
42” 41.5”
7”
44”
12” 12” 11”
NETC 3-Bar BR
6” 7”
34”
12” 11”
NETC 2-Bar BR
6” Integral concrete curb Integral concrete curb Sidewalk
Slide 8
5/8”-Diameter A307 Cap Screws Washer and Bushing/Spacer Washer Only
(bolt tension = 20 kip)
¾” ¼” internal gap (each side) Tested Design ¾” longitudinal gap
Slide 10
20 40 60 80 100 120 140 160 180
Report 350 (TL-4) AASHTO '98 (PL-2) MASH (TL-4) Impact Severity (kip-ft) Test Procedure small car test pick-up test SUT test
830C 2000P 8000S 1100C 2270P 10000S
Test Vehicles
Report 350 MASH
22 kip 56 mph 15 deg. 18 kip 50 mph 15 deg. 2.4 kip 62 mph 25 deg. 1.8 kip 62 mph 20 deg. 5.0 kip 62 mph 25 deg. 4.4 kip 62 mph 25 deg. 54%
1100C 2270P 10000S 830C 2000P 8000S
14% > mass 22% > mass 33% > mass 25% > angle 12% > speed
Rail Height Rail Geometrics Strength Rail Height Rail Geometrics Strength Rail Height Rail Geometrics Strength Required 29 71 k 36 in 80 k 36 in 80 k Actual 34 109 k 42 in 83-86 k 42 in 76-81 k* Assessment S S S(1) S S(2) S S M NS / S
NS - Not Satisfactory M - Marginal S - Satisfactory S
(1) - Satisfactory Rating for TL-3 Only
S
(2) - Satisfactory when 9" curb is used
* - Differs from 20-07(395) report (see Table 5) (see Table 5) (see Table 5)
NETC 2-Bar (TL3) NETC 3-Bar (TL4) NETC 4-Bar (TL4) S – 9” curb M – 7” curb
snag on posts and considers:
Slide 12
hardware.
comparing results to existing full-scale crash tests on the system.
types and impact conditions
evaluate the system’s performance.
Slide 13
Validation
performed by SwRI on 12/18/1997.
System Type: Comparison: Device Name:/Variant: Submissions Type: Non-Significant -- Effect is Uncertain Testing Criterion: Non-Significant -- Effect is Positive Test Level: Non-Significant -- Effect is Inconsequential FHWA Letter: X Baseline Validation of Crash Test to FEA Analysis.
Crash Test FEA Analysis
Test Number: Test FEA Occupant Risk (cont.) Test FEA Vehicle: yes yes H2 – Long. OIV 5.4 ft/s 5.9 ft/s Vehicle Mass: 0.51 in 0.7 in H3 – Lat. OIV 9.5 ft/s 12.1 ft/s Impact Speed:
I2 – Long. ORA 8.95 g 4.95 g Impact Location: no no I3 – Lat. ORA 14.3 g 12.1 g Tested Hardware: Original Design no no Vehicle Trajectory FEA Hardware: Original Design no no K – Intruded into travel lanes? no no no no N – Travel behind barrier? no no Total Energy: 0% Pass Test FEA Hourglass Energy: 0% Pass no no Sprague-Geer Magnitude < 40
0% Pass 20 14.7 Sprague-Geer Phase < 40
no Pass 5 5.4 ANOVA Mean
no Pass 14.8 16.2 ANOVA Standard Deviation
F3 – Max. Vehicle Pitch F4 – Max. Vehicle Yaw Crash tested original design to FEA of original design A5 – Barrier Rupture? A7 – Wheel Snagging? A8 – Vehicle Snagging? Occupant Risk D – Detached elements? Structural Adequacy A1 - Acceptable perf.? A2 – Permanent Deflection: A3 – Contact Length A4 - Component Failure Baseline Crash Test W-179 Table E-1: Verification Evaluation Summary W-179 Table E-3 (Multi-Channel Method) W-179 Table E-5: Roadside PIRTS Summary of FEA vs. Test Validation Metrics SwRI NETC-3 1993 International 4600 LP 17,875 lbs 49.8 mph 2 ft upstream of Post 6 Bridge Rail NETC 4-Bar sidewalk-mounted Report 350 TL4
Time = 0.0 sec 0.2 sec 0.4 sec 0.6 sec 0.9 sec 1.2 sec
Validation
Test 3-10
from critical Post
Test 3-11
from critical Post
Slide 16
Maximum dynamic deflection = 3.6 in (92 mm) Maximum dynamic deflection = 2.7 in (69 mm)
(mm)
Test 3-10 Test 3-11
(mm)
Slide 17
moderate.
assessment on the potential for wheel rim snag on the post could not be made; however, a moderate snag is possible.
Slide 18
5 10 15 20 25 30 35 40 OIV-x OIV-y THIV
OIV (ft/s)
OIV
Test 3-10 2 4 6 8 10 12 14 16 18 20 ORA-x ORA-y PHD
ORA (G)
ORA
Test 3-10
5 10 0.1 0.2 0.3 0.4 0.5 0.6 0.7 0.8 0.9 1 Y-acceleration (G's) Time (seconds)
y-acc (10-ms Avg.)
Test 3-10 Time of OIV
5 10 0.1 0.2 0.3 0.4 0.5 0.6 0.7 0.8 0.9 1 X-acceleration (G's) Time (seconds)
x-acc (10-ms Avg.)
Test 3-10 Time of OIV
Occupant Impact Velocity Occupant Ridedown Accelerations
Max Criteria Preferred Limit Max Criteria Preferred Limit
Slide 19
with the post, but the contact force was negligible.
passenger door snagged on the rail tube at the splice but resulting accelerations did not exceed
Front Wheel Snag Door Snag
Slide 20
5 10 15 20 25 30 35 40 OIV-x OIV-y THIV
OIV (ft/s)
OIV
Test 3-11 2 4 6 8 10 12 14 16 18 20 ORA-x ORA-y PHD
ORA (G)
ORA
Test 3-11
5 10 0.1 0.2 0.3 0.4 0.5 0.6 0.7 0.8 0.9 1 Y-acceleration (G's) Time (seconds)
y-acc (10-ms Avg.)
Test 3-11 Time of OIV
5 10 0.1 0.2 0.3 0.4 0.5 0.6 0.7 0.8 0.9 1 X-acceleration (G's) Time (seconds)
x-acc (10-ms Avg.)
Test 3-11 Time of OIV
20 Max Criteria Preferred Limit Max Criteria Preferred Limit
Occupant Impact Velocity Occupant Ridedown Accelerations
Slide 23
Evaluation Factors Evaluation Criteria Results Structural Adequacy A Test article should contain and redirect the vehicle or bring the vehicle to a controlled stop; the vehicle should not penetrate, underride, or override the installation although controlled lateral deflection of the test article is acceptable. Pass Occupant Risk D Detached elements, fragments, or other debris from the test article should not penetrate or show potential for penetrating the occupant compartment, or present undue hazard to other traffic, pedestrians, or personnel in a work zone. Deformations
exceed limits set forth in Section 5.2.2 and Appendix E. Pass F The vehicle should remain upright during and after collision. The maximum roll and pitch angles are not to exceed 75 degrees. Pass H The longitudinal and lateral occupant impact velocity (OIV) shall not exceed 40 ft/s (12.2 m/s), with a preferred limit of 30 ft/s (9.1 m/s) Pass I The longitudinal and lateral occupant ridedown acceleration (ORA) shall not exceed 20.49 G, with a preferred limit of 15.0 G Pass
Test 4-10
from critical Post
Test 4-11
from critical Post
Slide 25
Maximum dynamic deflection = 3.35 in (85 mm) Maximum dynamic deflection = 4.2 in (106 mm)
(mm)
Test 4-10 Test 4-11
Slide 26
Slide 27
Slide 28
5 10 15 20 25 30 35 40 OIV-x OIV-y THIV
OIV (ft/s)
OIV
Test 4-10 2 4 6 8 10 12 14 16 18 20 ORA-x ORA-y PHD
ORA (G)
ORA
Test 4-10
Occupant Impact Velocity Occupant Ridedown Accelerations
Max Criteria Preferred Limit Max Criteria Preferred Limit
Test 4-10 Test 4-10
5 10 15 20 25 30 35 40 OIV-x OIV-y THIV
OIV (ft/s)
OIV
Test 4-11 2 4 6 8 10 12 14 16 18 20 ORA-x ORA-y PHD
ORA (G)
ORA
Test 4-11
Max Criteria Preferred Limit Max Criteria Preferred Limit
Test 4-11 Test 4-11
Slide 31
Evaluation Factors Evaluation Criteria Results Structural Adequacy A Test article should contain and redirect the vehicle or bring the vehicle to a controlled stop; the vehicle should not penetrate, underride, or override the installation although controlled lateral deflection of the test article is acceptable. Pass Occupant Risk D Detached elements, fragments, or other debris from the test article should not penetrate or show potential for penetrating the occupant compartment, or present undue hazard to other traffic, pedestrians, or personnel in a work zone. Deformations
exceed limits set forth in Section 5.2.2 and Appendix E. Pass F The vehicle should remain upright during and after collision. The maximum roll and pitch angles are not to exceed 75 degrees. Pass H The longitudinal and lateral occupant impact velocity (OIV) shall not exceed 40 ft/s (12.2 m/s), with a preferred limit of 30 ft/s (9.1 m/s) Pass I The longitudinal and lateral occupant ridedown acceleration (ORA) shall not exceed 20.49 G, with a preferred limit of 15.0 G Pass
Test 4-12 (Case 1)
Post
Test 4-12 (Case 2)
critical Post
Slide 33
Bed Height = 47.5 inches Bed Height = 50 inches
Slide 34
Maximum dynamic deflection = 7.64 in (194 mm) Case 1 (47.5”)
(mm)
Case 2 (50”) Maximum dynamic deflection
7 8 9 6 5 7 8 9 6 5
Slide 35
Evaluation Factors Evaluation Criteria – MASH Test 4-12 Results Case 1/ Case 2 Structural Adequacy A Test article should contain and redirect the vehicle or bring the vehicle to a controlled stop; the vehicle should not penetrate, underride, or override the installation although controlled lateral deflection of the test article is acceptable. Pass/Pass Occupant Risk D Detached elements, fragments, or other debris from the test article should not penetrate or show potential for penetrating the occupant compartment, or present undue hazard to other traffic, pedestrians, or personnel in a work zone. Deformations of, or intrusions into, to
in Section 5.2.2 and Appendix E. Pass/Pass G It is preferable, although not essential, that the vehicle remain upright during and after collision. Pass/Fail
Test 4-10
from critical Post
Test 4-11
from critical Post
Slide 37
contact with the post, but the contact force was negligible.
lower-middle tube rail, which resulted in peak longitudinal acceleration of 21.6 G and Peak lateral acceleration of 25.8 G.
5 10 15 20 25 30 35 40 OIV-x OIV-y THIV
OIV (ft/s)
OIV
NETC 4-Bar 2 4 6 8 10 12 14 16 18 20 ORA-x ORA-y PHD
ORA (G)
ORA
NETC 4-Bar
5 10 0.1 0.2 0.3 0.4 0.5 0.6 0.7 0.8 0.9 1 X-acceleration (G's) Time (seconds)
x-acc (10-ms Avg.)
NETC 4-Bar Time of OIV
5 10 0.1 0.2 0.3 0.4 0.5 0.6 0.7 0.8 0.9 1 Y-acceleration (G's) Time (seconds)
y-acc (10-ms Avg.)
NETC 4-Bar Time of OIV
Occupant Impact Velocity Occupant Ridedown Accelerations
Max Criteria Preferred Limit Max Criteria Preferred Limit Front wheel snag at splice Front wheel snag at splice
Slide 39
contact with the post, but the contact force was negligible.
rail tube at the splice, resulting in maximum ORA.
Front of Vehicle Rear Tire
5 10 15 20 25 30 35 40 OIV-x OIV-y THIV
OIV (ft/s)
OIV
Test 4-11 2 4 6 8 10 12 14 16 18 20 ORA-x ORA-y PHD
ORA (G)
ORA
Test 4-11
5 10 15 0.1 0.2 0.3 0.4 0.5 0.6 0.7 0.8 0.9 1 X-acceleration (G's) Time (seconds)
x-acc (10-ms Avg.)
Test 4-11 Time of OIV
5 10 0.1 0.2 0.3 0.4 0.5 0.6 0.7 0.8 0.9 1 Y-acceleration (G's) Time (seconds)
y-acc (10-ms Avg.)
Test 4-11 Time of OIV
40 Max Criteria Preferred Limit Max Criteria Preferred Limit
Occupant Impact Velocity Occupant Ridedown Accelerations
Rear wheel snag at splice Rear tail-slap Model tends to
accelerations for tail-slap
Slide 41
Maximum dynamic deflection = 2.8 in (72 mm) Maximum dynamic deflection = 5.4 in (138 mm)
Test 4-10 Test 4-11
(mm) (mm)
Slide 42
Evaluation Factors Evaluation Criteria Results Structural Adequacy A Test article should contain and redirect the vehicle or bring the vehicle to a controlled stop; the vehicle should not penetrate, underride, or override the installation although controlled lateral deflection of the test article is acceptable. Pass Occupant Risk D Detached elements, fragments, or other debris from the test article should not penetrate or show potential for penetrating the occupant compartment, or present undue hazard to other traffic, pedestrians, or personnel in a work zone. Deformations
exceed limits set forth in Section 5.2.2 and Appendix E. Pass F The vehicle should remain upright during and after collision. The maximum roll and pitch angles are not to exceed 75 degrees. Pass H The longitudinal and lateral occupant impact velocity (OIV) shall not exceed 40 ft/s (12.2 m/s), with a preferred limit of 30 ft/s (9.1 m/s) Pass I The longitudinal and lateral occupant ridedown acceleration (ORA) shall not exceed 20.49 G, with a preferred limit of 15.0 G Pass
Slide 43
Post 7
Slide 44
Maximum dynamic deflection = 8.15 in (207 mm)
(mm)
in concrete at front anchor bolts at maximum dynamic deflection.
Dynamic at time = 0.515 seconds Final Static
Crack Opening Significant Crack Opening
Slide 46
Evaluation Factors Evaluation Criteria – MASH Test 4-12 Results Structural Adequacy A Test article should contain and redirect the vehicle or bring the vehicle to a controlled stop; the vehicle should not penetrate, underride, or override the installation although controlled lateral deflection of the test article is acceptable. Pass Occupant Risk D Detached elements, fragments, or other debris from the test article should not penetrate or show potential for penetrating the occupant compartment, or present undue hazard to other traffic, pedestrians, or personnel in a work zone. Deformations of, or intrusions into, to
in Section 5.2.2 and Appendix E. Pass G It is preferable, although not essential, that the vehicle remain upright during and after collision. Pass
Slide 47
damages are likely under these conditions.
Slide 48
(TL3) (NHDOT steel rail transition)
(TL4) (NHDOT steel rail transition)
Beam (TL4) (MaineDOT standard detail)
Slide 49
The transition system for the 2-Bar bridge rail was modeled based on the detailed drawing from NHDOT
Tube Rail Transition (2 layers) 12 ga. thrie beam 10 ga. End-shoe 3/8” thick connector plate 3/8” thick deflector plate 12 ga. W-beam Guardrail NETC 2-Bar BR
W6x25 Posts (typ.) 8’ long W6x9 Posts (typ.) 7’ long
Slide 50
Report 350 Test Level 3
< 15 G < 75° < 30 ft/s
Preferred Limits
401181-1
Test Designation Test 3-21 Test Vehicle 2000 Chevrolet 2500 Gross Vehicle Weight (lb) 4,706 Impact Speed (mph) 63.6 Impact Angle (deg) 24.9 Exit Speed (mph) 52.9 Exit Angle (deg) 11.7 Occupant Impact Velocity Longitudinal (ft/s) 17.1 Lateral (ft/s) 24.6 Ridedown Accel Longitudinal (g's) 8.3 Lateral (g's) 10 Maximum 50 msec Avg Accel Longitudinal (g's) 8.1 Lateral (g's) 13.5 Max Deflection (in) 7.87 Vehicle Trajectory Maximum YawAngle (deg) 56 Maximum Roll Angle (deg) 14 Maximum Pitch Angle (deg) 19 NCHRP Report 350 Evaluation Structural Adequacy Pass Ocupant Risk Pass Vehicle Trajectory Pass
Slide 51
Validation
FEA (0 - 1.0 seconds) (0 - 1.0 seconds) % Absolute Criteria Pass Occupant Impact Velocity x-direction 17.06 19.68 15.4% 2.62 <20% or < 6.6 f/s Y (ft/s) y-direction
1.3%
<20% or < 6.6 f/s Y at time
at 0.0948 seconds on left side of interior at 0.1005 seconds on left side of interior
29.9 31.5 5.5% 1.64 <20% or < 6.6 f/s Y
at 0.0948 seconds on left side of interior at 0.0986 seconds on left side of interior
Ridedown Acceleration
0.0% 0.00 <20% or < 4G Y (g's)
(0.1153 - 0.1253 seconds) (0.1018 - 0.1118 seconds)
10 7.5 25.0%
<20% or < 4G Y
(0.1182 - 0.1282 seconds) (0.1388 - 0.1488 seconds)
11.9 9.1 23.5%
<20% or < 4G Y
(0.1180 - 0.1280 seconds) (0.1344 - 0.1444 seconds)
1.74 1.48 14.9%
<20% or < 0.2 Y
(0.0216 - 0.0716 seconds) (0.0355 - 0.0855 seconds)
Max 50-ms moving avg. acc.
18.5%
<20% or < 4G Y (g's)
(0.0334 - 0.0834 seconds) (0.0342 - 0.0842 seconds)
13.5 11 18.5%
<20% or < 4G Y
(0.0216 - 0.0716 seconds) (0.0448 - 0.0948 seconds)
50.0% 3.80 <20% or < 4G Y
(0.0209 - 0.0709 seconds) (0.0359 - 0.0859 seconds)
55.6 48.2 13.3%
<20% or < 5 deg Y
(1.0000 seconds) (0.9426 seconds)
12.4% 2.40 <20% or < 5 deg Y
(0.5914 seconds) (0.4713 seconds)
20.4%
<20% or < 5 deg Y
(0.6647 seconds) (0.5674 seconds)
Maximum Angular Disp. (deg) Roll Yaw THIV (m/s) x-direction y-direction PHD (g's) ASI x-direction y-direction Pitch Error W179 Criteria MASH Test 3-11 Occupant Risk Factors z-direction Test 401181-1
Slide 53
Test 4-20
from critical Post
Test 4-21
from end of tube rail
Slide 54
Test 4-20
from critical Post
Test 4-21
from end of tube rail
Slide 55
Test 4-20
from critical Post
Test 4-21
from end of tube rail
Slide 56
Evaluation Factors Evaluation Criteria Results Structural Adequacy A Test article should contain and redirect the vehicle or bring the vehicle to a controlled stop; the vehicle should not penetrate, underride, or override the installation although controlled lateral deflection of the test article is acceptable. Pass Occupant Risk D Detached elements, fragments, or other debris from the test article should not penetrate or show potential for penetrating the occupant compartment, or present undue hazard to other traffic, pedestrians, or personnel in a work zone. Deformations
exceed limits set forth in Section 5.2.2 and Appendix E. Pass F The vehicle should remain upright during and after collision. The maximum roll and pitch angles are not to exceed 75 degrees. Pass H The longitudinal and lateral occupant impact velocity (OIV) shall not exceed 40 ft/s (12.2 m/s), with a preferred limit of 30 ft/s (9.1 m/s) Pass I The longitudinal and lateral occupant ridedown acceleration (ORA) shall not exceed 20.49 G, with a preferred limit of 15.0 G Pass
Slide 57
Ford 800 Surrogate
47.5”
9 ft
Critical snag point
Rail tube ends
Slide 58
Rail tube ends
Slide 59
components were primarily to the top
three (3) bridge rail posts.
the transition rail elements.
the bottom of the cargo-box snagging
torque rotation and longitudinal deformation of the posts.
barrier from the point of contact until the truck box slid off the end of the bridge rail at 0.55 seconds.
exiting the barrier was 3.9 ft resulting from the top of the cargo box extending over the bridge rail.
3.9’
Working width
Slide 60
Baseline Original Design (3 ft) Case 2 – ¾” Splice Gap and Tapered Post (5.5 ft) – ¾” Splice Gap and Original – 2”
Slide 61
Evaluation Factors Evaluation Criteria – MASH Test 4-12 Results Structural Adequacy A Test article should contain and redirect the vehicle or bring the vehicle to a controlled stop; the vehicle should not penetrate, underride, or override the installation although controlled lateral deflection of the test article is acceptable. Pass Occupant Risk D Detached elements, fragments, or other debris from the test article should not penetrate or show potential for penetrating the occupant compartment, or present undue hazard to other traffic, pedestrians, or personnel in a work zone. Deformations of, or intrusions into, to
in Section 5.2.2 and Appendix E. Pass G It is preferable, although not essential, that the vehicle remain upright during and after collision. Pass
Slide 62
considerable damage to the system, particularly in the SUT test.
MASH requirements due to snag and high decelerations for small car test
Slide 63
focus of this study; however, general recommendations were provided to further improve crash performance, including:
lateral movement in the splice connections.
improve geometric attributes and strength.
snagging on the top of the posts when parts
trucks) overhang the top rail.
https://www.newenglandtransportationconso rtium.org/research/netc-research- projects/netc-18-1/
OIVx OIVy ORAx ORAy Roll Pitch (mph) (deg) ft (in) Location (in) (ft/s) (ft/s) (g) (g) (deg) (deg) Test 3-10 62 25 3.6 Pass 3.6 Wheel Well/ Toe Pan 3.3 26.2 33.1 5.5(1) 6.4 7 5.4 Pass Test 3-11 62 25 4.3 Pass 2.7 Wheel Well/ Toe Pan 2.8 20.7 26.9 4.6 15.4(2) 9 10.1 Pass Test 4-10 62 25 3.6 Pass 3.4 Wheel Well/ Toe Pan 2.8 25.6 32.5 6.7(1) 6 7.3 5.2 Pass Test 4-11 62 25 4.3 Pass 4.2 Wheel Well/ Toe Pan 3.3 22 26.6 4.7 15.4(2) 9.9 7.5 Pass Test 4-12(3) 56 15 5 Pass 7.6 Wheel Well/ Toe Pan 1 2 14.8 7 5.3 20.8 7.8 Pass Test 4-12(4) 56 15 5 Pass 8.1 Wheel Well / lower edge of door 3.3 3 14.1 5.7 5.9 90* 6.9 Pass
Mod 3-Bar†
Test 4-10 62 25 3.6 Pass 2.3
32.5 3.5(1) 7.7
Test 4-10 62 25 3.6 Pass 2.8 Wheel Well/ Toe Pan 3.4 24 31.5 7.1(1) 10.3 10.9 6.5 Pass Test 4-11 62 25 4.3 Pass 5.4 Wheel Well/ Toe Pan 2.2 17.7 26.6 13.8 18(2) 7.2 8.3 Pass Test 4-12(3) 56 15 5 Pass 8.2 Wheel Well/ Toe Pan 1 3.9 16.7 4.3 6.7 18.8 5.6 Pass
Mod 4-Bar‡
Test 4-12(3) 56 15 5 Pass 8.2 Not Evaluated 1 3.9 16.7 4.3 6.7 18.8 5.6 Pass Test 3-20 62 25 6.5 Pass 6.3 Wheel weel / Toe Pan 1.4 25.3 28.2 7.9(1) 4.8 6.7 3.6 Pass Test 3-21 62 25 9 Pass 11.8 negligible
23.3 4.8 17.2(2) 9.3 5.5 Pass Test 4-20 62 25 5.5 Pass 5.8 Wheel Well/ Toe Pan 1 24.3 25.9 4.2(1) 7.4 6.2 3.9 Pass Test 4-21 62 25 5.5 Pass 8 negligible
24.6 5.2 15.1(2) 8.1 3.7 Pass Test 4-22 56 15 9 Pass 7.6 Wheel Well/ Toe Pan 1 2.3 14.8 8.9 5.5 90* 11.9 Pass** Test 4-20 62 25 5.5 Pass 6.9 Wheel Well/ Toe Pan 3.4 29.2 32.8 26 7.9(2) 5.4 6.8 Fail Test 4-21 62 25 6.5 Pass 8.3 Wheel Well/ Toe Pan 1 21 28.2 9.4 17.3 15.4 9.6 Pass Test 4-22 56 15 12 Pass 17.0 Wheel Well/ Toe Pan 5.5 8.9 14.4 13.9 8.7 8.7 12 Pass*** Test 4-20§ 62 25 4 Pass 3.25
33.1 4.9 2.9(2)
Test 4-20§§ 62 25 4 Pass 2.65
32.8 3.7 7.9(2) 4.4 5.1 Pass Test 4-21§ 62 25 6 Pass
27.9 5.8 ≈18-19
Test 4-22Ⱡ 56 15 9 Pass 5.4
* The vehicle was still upright when the analysis was terminated, but 90-degree roll was expected. ** Resulted in significant snagging on and damage to bridge rail posts. *** The analysis showed that the barrier contained and redirected the 10,000S vehicle, but with significant damage to the transition and bridge rail elements.
(1) Maximum ORA occurred on tail-end of a major acceleration pulse. Would have been higher if OIV had occured slightly sooner. (2) Vehicle model tends to over-predict lateral accelerations associated with "tail-slap". (3) Cargo-box Bed Height = 47.5 ". (4) Cargo-box Bed Height = 50 ".† NETC 3-bar with HSS 5x4x5/16 lower rail ‡ NETC 4-bar with W8x28 posts § 3-bar AGT with original components §§ 3-bar AGT with HSS5x4x5/16 lower rail Ⱡ 3-bar AGT with 2-inch splice gap and top of posts tapered
Vehicle Stability Overall Result
Contain OCI
System Type System MASH Test No. Impact Conditions RESULTS
Speed Angle CIP Structural Adequacy
Occupant Risk Metrics 4-Bar (Concrete
Butress)
NETC 2-Bar NETC 3-Bar Bridge Rail AGT 2-Bar
(Tube Rails)
3-Bar
(Tube Rails)
NETC 4-Bar 3-Bar
(Tube Rails) w/ 5.5-ft Post Space
Slide 65
The following are the members of the Technical Committee that developed the scope of work for the project and provided technical oversight throughout the course of the research: