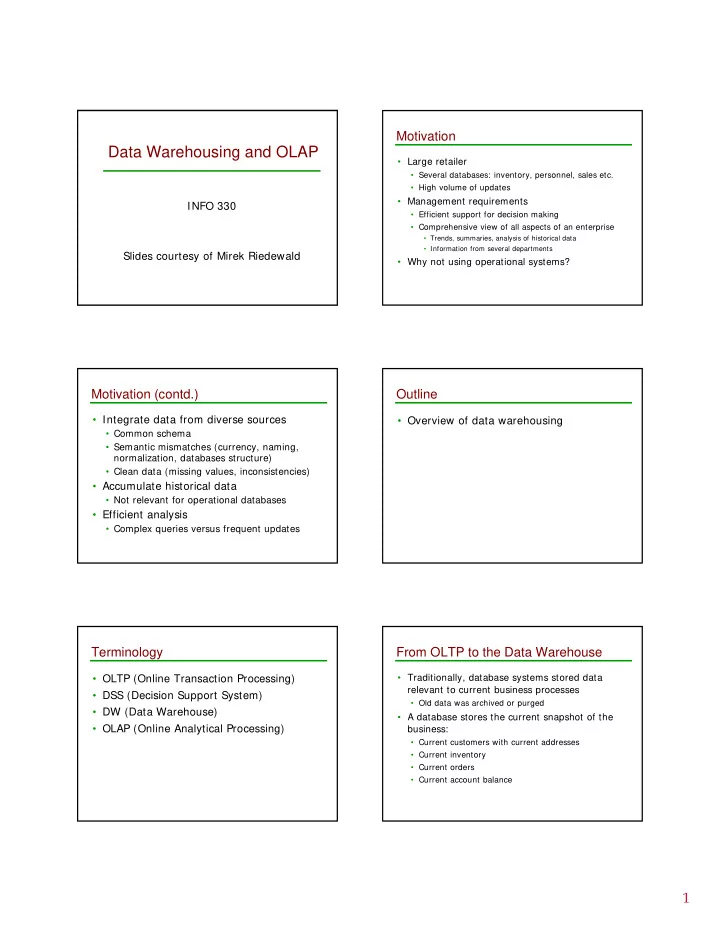
Data Warehousing and OLAP Large retailer Several databases: - - PDF document

data warehousing and olap
SMART_READER_LITE
LIVE PREVIEW

Data Warehousing and OLAP Large retailer Several databases: - - PDF document

Motivation Data Warehousing and OLAP Large retailer Several databases: inventory, personnel, sales etc. High volume of updates Management requirements INFO 330 Efficient support for decision making Comprehensive view


slide-1
SLIDE 1

1

Data Warehousing and OLAP

INFO 330 Slides courtesy of Mirek Riedewald

Motivation

  • Large retailer
  • Several databases: inventory, personnel, sales etc.
  • High volume of updates
  • Management requirements
  • Efficient support for decision making
  • Comprehensive view of all aspects of an enterprise
  • Trends, summaries, analysis of historical data
  • Information from several departments
  • Why not using operational systems?

Motivation (contd.)

  • Integrate data from diverse sources
  • Common schema
  • Semantic mismatches (currency, naming,

normalization, databases structure)

  • Clean data (missing values, inconsistencies)
  • Accumulate historical data
  • Not relevant for operational databases
  • Efficient analysis
  • Complex queries versus frequent updates

Outline

  • Overview of data warehousing

Terminology

  • OLTP (Online Transaction Processing)
  • DSS (Decision Support System)
  • DW (Data Warehouse)
  • OLAP (Online Analytical Processing)

From OLTP to the Data Warehouse

  • Traditionally, database systems stored data

relevant to current business processes

  • Old data was archived or purged
  • A database stores the current snapshot of the

business:

  • Current customers with current addresses
  • Current inventory
  • Current orders
  • Current account balance
slide-2
SLIDE 2

2

The Data Warehouse

  • The data warehouse is a historical collection of

all relevant data for analysis purposes

  • Examples:
  • Current customers versus all customers
  • Current orders versus history of all orders
  • Current inventory versus history of all shipments
  • Thus the data warehouse stores information

that might be useless for the operational part of a business

OLTP Architecture

OLTP DBMSs Clients Cash Register Product Purchase Inventory Update

DW Architecture

Information Sources Data Warehouse Server OLAP Servers OLTP DBMSs Other Data Sources Extract Clean Transform Aggregate Load Update Data Marts MOLAP ROLAP

Analysis Query/Reporting Data Mining

Building a Data Warehouse

  • Data warehouse is a collection of data marts
  • Data marts contain one dimensional star

schema that captures one business aspect

  • Notes:
  • It is crucial to centralize the logical definition and

format of dimensions and facts (political challenge; assign a dimension authority to each dimension). Everything else is a distributed effort throughout the company (technical challenge)

  • Each data mart will have its own fact table, but

dimension tables are duplicated over several data marts

OLTP Versus Data Warehousing

Focus No of concurrent users No of records accessed Level of isolation required Unit of interaction Types of queries Workload System usage Typical user Data in and out Thousands < 100 High Transaction Predefined Read/Write Regular business Clerical worker OLTP Information out Hundreds > 1,000,000 Low Query Ad-hoc Read only Analysis Management Data Warehouse

Three Complementary Trends

  • Data Warehousing: Consolidate data from

many sources in one large repository

  • Loading, periodic synchronization of replicas
  • Semantic integration
  • OLAP:
  • Complex SQL queries and views
  • Queries based on spreadsheet-style operations and

“multidimensional” view of data

  • Interactive and “online” queries
  • Data Mining: Exploratory search for interesting

trends and anomalies.

slide-3
SLIDE 3

3

Data Warehousing

  • Integrated data spanning

long time periods, often augmented with summary information

  • Several gigabytes to

terabytes common

  • Interactive response

times expected for complex queries; ad-hoc updates uncommon

EXTERNAL DATA SOURCES EXTRACT TRANSFORM LOAD REFRESH DATA WAREHOUSE

Metadata Repository

SUPPORTS

OLAP

DATA MINING

Warehousing Issues

  • Semantic Integration: When getting data from

multiple sources, must eliminate mismatches, e.g., different currencies, schemas

  • Heterogeneous Sources: Must access data from

a variety of source formats and repositories

  • Replication capabilities can be exploited here
  • Load, Refresh, Purge: Must load data,

periodically refresh it, and purge too-old data

  • Metadata Management: Must keep track of

source, loading time, and other information for all data in the warehouse

Outline

  • Overview of data warehousing
  • Dimensional Modeling

Dimensional Data Modeling

  • Recall: The relational model

The dimensional data model:

  • Relational model with two different types of

attributes and tables

  • Attribute level: Facts (numerical, additive,

dependent) versus dimensions (descriptive, independent)

  • Table level: Fact tables (large tables with facts and

foreign keys to dimensions) versus dimension tables (small tables with dimensions)

Dimensional Modeling (contd.)

  • Fact (attribute):

Measures performance

  • f a business
  • Example facts:
  • Sales, budget, profit,

inventory

  • Example fact table:
  • Transactions (timekey,

storekey, pkey, promkey, ckey, units, price)

  • Dimension (attribute):

Specifies a fact

  • Example dimensions:
  • Product, customer

data, sales person, store

  • Example dimension

table:

  • Sales(productid,

storeid, …)

OLTP versus Data Warehouse

OLTP

  • Regular relational

schema

  • Normalized
  • Updates overwrite

previous values: One instance of a customer with a unique customerID

  • Queries return

information about the current state of affairs

Data warehouse

  • Dimensional model
  • Fact table in BCNF
  • Dimension tables not

normalized: few updates, mostly queries

  • Updates add new version:

Several instances of the same customer (with different data, e.g., address)

  • Queries return aggregate

information about historical facts

slide-4
SLIDE 4

4

Example: Dimensional Data Modeling

ckey timekey pkey #units $price

ckey cid name byear state pkey pid pname price category

timekey Day Month Year

Transactions: Fact Table Customers: Dimension Table Time:

  • Dim. Table

Products:

  • Dim. Table

Another View: Star Schema

Transactions (timekey, storekey, pkey, promkey, ckey, units, price) Time Store Customers Products Promotions

Fact versus Dimension Tables

  • Fact tables are usually very large; they

can grow to several hundred GB and TB

  • Dimension tables are usually smaller

(although can grow large, e.g., Customers table), but they have many fields

  • Queries over fact tables usually involve

many records

Grain

  • The grain defines the level of resolution of

a single record in the fact table.

  • Example fact tables:
  • Transactions (timekey, storekey, pkey,

promkey, ckey, units, price); grain is individual item

  • Transactions (timekey, storekey, ckey, units,

price); grain is one market basket

Typical Queries

  • SQL:

SELECT D1.d1, …, Dk.dk, agg1(F.f1) FROM Dimension D1, …, Dimension Dk, Fact F WHERE D1.key = F.key1 AND … AND Dk.keyk = F.keyk AND

  • therPredicates

GROUP BY D1.d1, …, Dk.dk HAVING groupPredicates

  • This query is called a “Star Join”.

Example Query

  • “Break down sales by year and category for the

last two years; show only categories with more than $1M in sales.”

  • SQL:

SELECT T.year, P.category, SUM(X.units * X.price) FROM Time T, Products P, Transactions X WHERE T.year = 1999 OR T.year = 2000 GROUP BY T.year, P.category HAVING SUM(X.units * X.price) > 1000000

slide-5
SLIDE 5

5

Outline

  • Overview of data warehousing
  • Dimensional Modeling
  • Online Analytical Processing

Online Analytical Processing (OLAP)

  • Ad hoc complex queries
  • Simple, but intuitive and powerful query

interface

  • Spreadsheet influenced analysis process
  • Specialized query operators for

multidimensional analysis

  • Roll-up and drill-down
  • Slice and dice
  • Pivoting

Visual Intuition: Cube

Customer Data Mart

Product Time

M T W Th F S S Product1 Product2 Product3 Product4 Product5 Product6 SH SF LA 20 30 20 15 10 50

50 Units of Product6 sold on Monday in LA

roll-up to week roll-up to category roll-up to state

Multidimensional Data Analysis

Data warehouse:

Transactions(ckey, timekey, pkey, units, price) Customers(ckey, cid, name, byear, city, state, country) Time(tkey, day, month, quarter, year) Products(pkey, pname, price, pid, category, industry)

Hierarchies on dimensions:

Industry Category Product Country State City Year Quarter Month Week Day

Multidimensional Data Analysis

Industry Category Country=“USA” State City Year Quarter Month Week Day Product

$3000 $3000 $3000 Industry3 Industry2 Industry1 $500 $1000 NY $1000 $2000 CA $500 $1000 WI

Corresponding Query in SQL

  • SELECT SUM(units)

FROM Transactions T, Products P, Customers C WHERE T.pkey = P.pkey AND T.ckey = C.ckey AND C.country = “USA” GROUP BY P.industry, C.state

  • We think that Industry3 in CA is interesting.

Country=“USA” State City Year Quarter Month Week Day Industry Category Product

slide-6
SLIDE 6

6

Slice and Drill-Down

Industry=“Industry3” Category Country State=“CA” City Year Quarter Month Week Day Product

$100 $800 $100 Category3 Category2 Category1 $300 $300 San Francisco $300 $300 San Jose $400 $400 Los Angeles

Corresponding Query in SQL

  • SELECT SUM(units)

FROM Transactions T, Products P, Customers C WHERE T.pkey = P.pkey AND T.ckey = C.ckey AND P.industry = “Industry3” AND C.state = “CA” GROUP BY P.category, C.city

  • We think that Category3 is interesting.

Industry=“Industry3” Category Country State=“CA” City Quarter Month Week Day Product Year

Slice and Drill-Down

Industry Category=“Category3” Country State=“CA” City Quarter Month Week Day Product Year

$60 $480 $60 Product3 Product2 Product1 $20 $20 San Francisco $160 $160 San Jose $20 $20 Los Angeles

Corresponding Query in SQL

  • SELECT SUM(units)

FROM Transactions T, Products P, Customers C WHERE T.pkey = P.pkey AND T.ckey = C.ckey AND C.state = “CA” AND P.category = “Category3” GROUP BY P.product, C.city

  • Nothing new in this view of the data.

Quarter Month Week Day Year Industry Category=“Category3” Country State=“CA” City Product

Pivot To (City, Year)

Quarter Month Week Day Year Industry Category=“Category3” Country State=“CA” City Product

1999 1998 1997 $60 $20 $20 San Francisco $100 $600 $100 San Jose $60 $20 $20 Los Angeles

Corresponding Query in SQL

  • SELECT SUM(units)

FROM Transactions T, Products P, Customers C WHERE T.pkey = P.pkey AND T.ckey = C.ckey AND C.state = “CA” AND P.category = “Category3” GROUP BY C.city, T.year Industry Category=“Category3” Country State=“CA” City Quarter Month Week Day Product Year

slide-7
SLIDE 7

7

Multidimensional Data Analysis

Set of data manipulation operators

  • Roll-up: Go up one step in a dimension hierarchy

(e.g., month -> quarter)

  • Drill-down: Go down one step in a dimension

hierarchy (e.g., quarter -> month)

  • Slice: Select a value of a dimension (e.g., all

categories -> only Category3)

  • Dice: Select range of values of a dimension (e.g.,

Year > 1999)

  • Pivot: Select new dimensions to visualize the data

(e.g., pivot to Time(quarter) and Customer(state))

The CUBE Operator

  • Generalizing GROUP BY and aggregation
  • If there are k dimensions, we have 2k possible

SQL GROUP BY queries that can be generated through pivoting on a subset of dimensions.

  • CUBE pid, locid, timeid BY SUM Sales
  • Equivalent to rolling up Sales on all eight subsets
  • f the set { pid, locid, timeid} ; each roll-up

corresponds to an SQL query of the form: SELECT SUM(S.sales) FROM Sales S GROUP BY grouping-list Lots of recent work on

  • ptimizing the CUBE operator!

Example Multidimensional View Of CUBE OLAP Server Architectures

  • Relational OLAP (ROLAP)
  • Relational DBMS stores data mart (star schema)
  • OLAP middleware:
  • Aggregation and navigation logic
  • Optimized for DBMS in the background, but slow and

complex

  • Multidimensional OLAP (MOLAP)
  • Specialized array-based storage structure
  • Desktop OLAP (DOLAP)
  • Performs OLAP directly at your PC
  • Hybrids and Application OLAP

Summary: Multidimensional Analysis

  • Spreadsheet style data analysis
  • Roll-up, drill-down, slice, dice, and pivot

your way to interesting cells in the CUBE

  • Mainstream technology
  • Established enterprises already have OLAP

installations

slide-8
SLIDE 8

8

Summary

  • Decision support is a rapidly growing subarea of

databases

  • Involves the creation of large, consolidated data

repositories called data warehouses

  • Warehouses are exploited using sophisticated

analysis techniques: complex SQL queries and OLAP “multidimensional” queries (influenced by both SQL and spreadsheets)

  • New techniques for database design, indexing,

view maintenance, and interactive querying need to be supported