Data and method risk and especially the severity Exponential Model - - PDF document

data and method
SMART_READER_LITE
LIVE PREVIEW

Data and method risk and especially the severity Exponential Model - - PDF document

32 nd ICTCT Conference in Warsaw, Poland Agenda Background Data Large-scale study on speed- Method calming effect from speed hump Results Niels Agerholm, Aalborg University, Denmark Summary Research Question Why is it of interest? Speed


slide-1
SLIDE 1

Niels Agerholm, Aalborg University, Denmark

Large-scale study on speed- calming effect from speed hump

32nd ICTCT Conference in Warsaw, Poland

Agenda

Background Data Method Results Summary
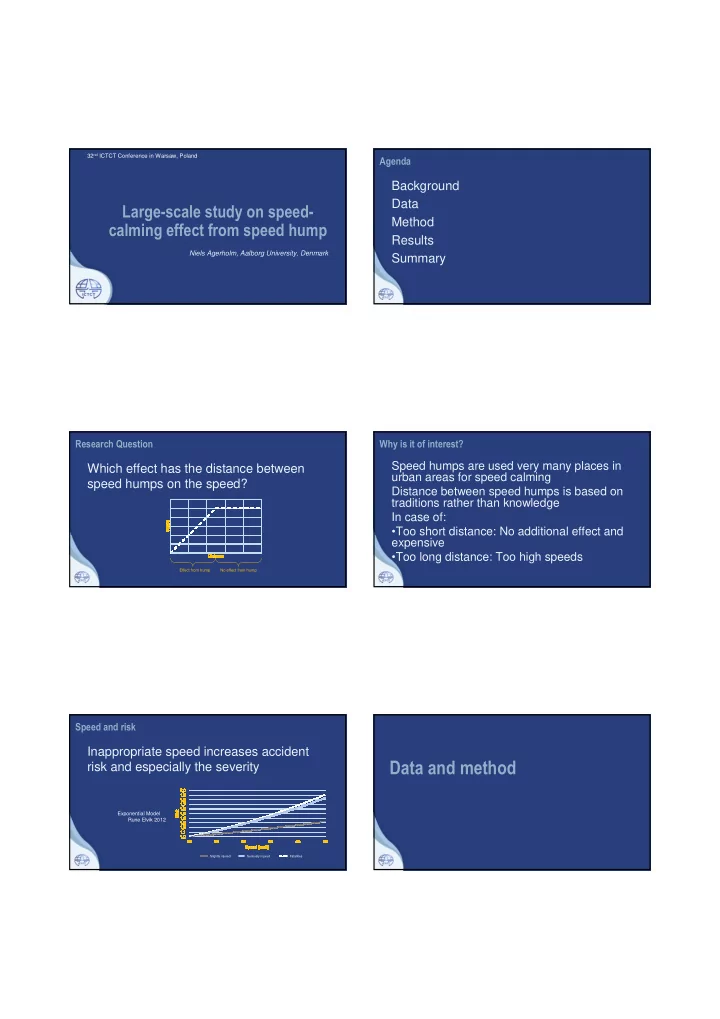
Research Question

Which effect has the distance between speed humps on the speed?

Effect from hump No effect from hump

Why is it of interest?

Speed humps are used very many places in urban areas for speed calming Distance between speed humps is based on traditions rather than knowledge In case of:

  • Too short distance: No additional effect and

expensive

  • Too long distance: Too high speeds

Speed and risk

Inappropriate speed increases accident risk and especially the severity

Slightly injured Seriously injured Fatalities

Exponential Model Rune Elvik 2012

Data and method

slide-2
SLIDE 2

Data collection

Floating Car Data (FCD) from ITS Platform

431 persons got an OBU installed Region North Denmark May2012 – December 2014 1 Hz data 1.3 Billion positions Driven distance: 15 Million km Selection of road segments

  • Comparable conditions of the road segments
  • Speed limit 50 km/h
  • No other speed calming measures/effects as
  • Curves
  • Speed calming measures
  • ”give way roads”
  • Further design

Segment data

  • Other speed-affecting variables
  • Road type

1. Local suburban road 2. Distributor road between neibourhoods 3. Through roads

  • Road side characteristics
  • Bicycle paths
  • Pavement
  • Bicycle lane
  • Road width
  • Distance to physical buildings

Segment definition

  • The distance between two speed humps is defined

as a segment

  • Segments from urban zone starts to speed humps

are removed

  • Segments where other speed affecting are recorded

are removed

Segment

From single observations to road segments I

Map matching

  • Each position is connected to one road segment

Road centre line Expected area Actual area

From single observations to road segments II Unit for estimations:

  • 1 observation per

trip

  • 85% percentile for

each segment

Segment 1 Segment 2

slide-3
SLIDE 3

570 speed humps 378 segments

Modified sinus bump

Transverse

Overall results Overall results II

  • Outlier removal

(8)

  • Low data volume

(12)

  • Few trips
  • Few individual

vehicles

Connection between distances and speed Connection between road type, distances and speeding

Spee violation:

Local road: 40 % Distributor roads: 87 % Through roads: 99 % Total: 91 %

Through Road Distributor Road Local Road

Modelling

Modelling:

Univariate analysis Explaining variables:

Distance Road type Distance to buildings

Through Road Distributor Road Local Road

slide-4
SLIDE 4

Summary

  • 150 m between speed humps seems to

be too long

  • Above 190 m there seems to be no

connection between speed and distance

  • Road type and distance to building

seems to be most important

Acknowledement

We would like to thank:

  • The Danish Innovation Fund via the

DiCyPS Center

  • The ITS Platform
  • European Regional Development Fund
  • The North Denmark Region

Thank you

Lasse Høyrup Sørensen lhsn@cowi.com Pelle Rosenbeck Gøeg Aalborg University prg@civil.aau.dk Niels Agerholm Division of Transportation Engineering

  • Dep. of Civil Engineering

Aalborg University +45 61 78 04 55 na@civil.aau.dk