
SLIDE 1
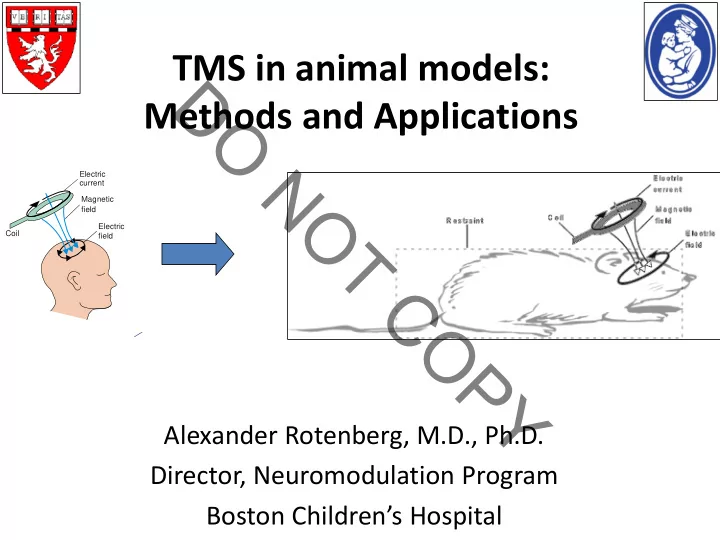
TMS in animal models: Methods and Applications
Alexander Rotenberg, M.D., Ph.D. Director, Neuromodulation Program Boston Children’s Hospital
Coil Electric field Magnetic field Electric current
D Methods and Applications O N Electric current O Magnetic - - PowerPoint PPT Presentation
TMS in animal models: D Methods and Applications O N Electric current O Magnetic field Electric Coil T field C O P Y Alexander Rotenberg, M.D., Ph.D. Director, Neuromodulation Program Boston Childrens Hospital Conflict of
Coil Electric field Magnetic field Electric current
Current:
Neuro’motion Inc. (technology for improving emotional control; co-founder) NeuroRex (medical advisor) Brainsway Inc. (research support [equipment and personnel]) Soterix Medical Inc. (research support [equipment]) Neuroelectrics Inc. (research support [equipment]) Journal of Central Nervous System Diseases (EIC) NIH NIMH, DoD, CIMIT, ERF, TRP (research grants)
Past:
Neuropace Inc. (research grant and equipment) Nexstim Inc. (consultant) Sage Therapeutics Inc. (consultant) Fisher Family Fund and Fisher-Wallace Inc. (research support [unrestricted gift and equipment])
Poma et al., 2006
Liebetanz et al., 2003
Charlet de Sauvage et al. 2007
Valero Cabre et al., 2005
Valero-Cabre et al. 2006 20 Hz off-line 20 Hz on-line 1 Hz on-line
Kistsen et al., in progress
Luft et al., 2001 Kamida et al., 1998
Frye, Rotenberg, et al. Child Neurol 2007
Rotenberg et al., 2009 EMG EMG Ground
Frye, Rotenberg, et al. Child Neurol 2007
1
Conditioning TMS 2 Test TMS Control SICI; 2 ms ISI ICF; 12 ms ISI
0.5 mV 25 ms
LICI; 200 ms ISI
0.5 mV 50 ms
Rotenberg and Pascual-Leone, 2010
Vahabzadeh et al., 2011
Vahabzadeh et al., 2011
Vahabzadeh et al., 2011
A B
PTZ Effects on MEP Inhibition by ppTMS
Accelerometer
MMG (V)
0.00 0.05 0.10 0.15 50ms
60%MO 70%MO 80%MO 90%MO 100%MO
MMG
Input–output curve of MMG
EMG (Tibia anterior m.)
Awake rat
200ms ISI
Condition
Pre P10 P60 Pre P10 P60 Pre P10 P60
% of unconditioned MMG
20 40 60 80 Saline PB PTZ
Left Right Ave (L+R)
*** * *** * *** *
Nature Protocols, 2011 McIntosh et al., 1989
50ms ISI
L R L R L R
% of unconditioned MMG
20 40 60 80 100 120 Normal rats Chronic TBI rats
100ms ISI 200ms ISI
** * * *
2mm
Gradual decrease in LICI reaches significance at 1 week after TBI as compared to pre-values. More detailed data compared between sham and TBI group in LICI at 100 ms (C) and 200 ms ISI (D) following TBI. (*p<0.05, **p<0.01)
100ms ISI
Time
Pre 1WK 2WKS 3WKS 4WKS 5WKS 6WKS
Ratio
0.0 0.2 0.4 0.6 0.8 1.0 Sham control TBI
** * * *
200ms ISI
Time
Pre 1WK 2WKS 3WKS 4WKS 5WKS 6WKS
Ratio
0.0 0.2 0.4 0.6 0.8 1.0 Sham control TBI
** * * * * * Hsieh et al., ECCN 2011 abstr.
4 2 Sham control TBI (lesion) 4 2 6 6
NeuN
4 2 TBI (contra-lesion) 6 I II/III V VI
Layer V thickness NeuN
Gonchar et al., 2007, Front Neuroanat.
4 2 Sham control Post-TBI (peri-lesion) 4 2 6 6
PV
4 2 Post-TBI (contra-lesion) 6 I II/III V VI * *** *** * n.s. n.s. Peri-lesion Contra-lesion
8-oxo-dG
I II/III V VI 4 2 Sham control Post-TBI (peri-lesion) 4 2 6 6 4 2 Post-TBI (contra-lesion) 6
n.s. *** *** ** n.s. n.s. Peri-lesion Contra-lesion
Antioxidant (N-acetylcysteine) Oxidative stress Loss of PV-cells ↓ Perineuronal nets ↓ Otx2 Impaired inhibition Neuroprotection (Otx2) Lee et al., 2013
ppTMS-MMG at 200ms ISI
Time
Pre 1W 2W 3W 4W 5W 6W
Ratio of unconditioned MMG
0.0 0.2 0.4 0.6 0.8 1.0 1.2 Saline CTX
n=7 (saline) n=7 (CTX)
n=3 (saline) n=3 (CTX)
p=0.07 p=0.04 p=0.05 p=0.002
n=7 (saline) n=6 (CTX)
Hameed et al., 2014
Frye, Rotenberg, et al. Child Neurol 2007
Rotenberg, et al., 2005 Ives et al., 2006 EKG EEG
Rotenberg, Brain Topogr 2010
EEG analysis (seizure detection) coil electric current magnetic field electric field torso strap restraints
Ives, Rotenberg et al., Clin Neurophys2006
5 sec
Rotenberg et al., Clin Neurophys 2008
rTMS during KA seizures
Relative Average Seizure Duration (% untreated control) 0.25 Hz
0% 25% 50% 75% 100% 125% 150%
0.5 Hz
0.75 Hz
untreated sham active
untreated sham active untreated sham active
Rotenberg et al., 2008
KA only Control KA + TMS Rotenberg et al., AES abstr 2005
.3 .5 1
5 1 1 5 c h a n g e H z
Rotenberg et al., unpublished data % reduction in Seizure Frequency After rTMS
Nakano et al., 2004
Muller et al., PLOS One 2014
*
1 0.5 0.25 S1 S0.5 S0.25
Stimulation Condition (Hz)
0% 50% 100% 150% 200% 250% 300%
20 Hz rTMS Sham
pCREB (% control) 20 Hz rTMS Sham
anesthetized awake Gersner et al., J. Neursci 2011
Gersner et al., J. Neursci 2011
Follow-up
Work in Progress: Time (min)
10 20 30
Baseline Anesthesia Kainic acid injection rTMS/Sham
Lorazepam Follow-up Sham/rTMS /Lorazepam
Spike suppression by 20 Hz rTMS
A
Sham rTMS 30 sec Baseline Treatment Follow-up
0.5 1 1.5 2 2.5 Baseline Treatment Follow-up Normalized spike frequency (auto-count)
Baseline Treatment Follow-up
B C
Time (sec)
The effect of Lorazepam and rTMS combination treatment on spike frequency LZP + Sham LZP + LZP LZP + rTMS 2nd treatment Baseline LZP Follow-up 30 sec
0.2 0.4 0.6 0.8 1 1.2 1.4 BL 1st 2nd FU Normalized spike frequency (auto-count)
Baseline LZP Follow-up 2nd Treatment
Hsieh et al., work in progress
Hsieh et al., work in progress