Current Conditions & Outlook in Credit Markets A Tale of Three - - PDF document

current conditions outlook in credit markets
SMART_READER_LITE
LIVE PREVIEW

Current Conditions & Outlook in Credit Markets A Tale of Three - - PDF document

Current Conditions & Outlook in Credit Markets A Tale of Three Periods Dr. Edward Altman NYU Stern School of Business Distressed Assets Symposium University of Toronto Faculty of Law Toronto, Canada March 03, 2010 1 YTM Spread Betw


slide-1
SLIDE 1

1

  • Dr. Edward Altman

NYU Stern School of Business

Current Conditions & Outlook in Credit Markets

A Tale of Three Periods

Distressed Assets Symposium University of Toronto Faculty of Law Toronto, Canada March 03, 2010

2

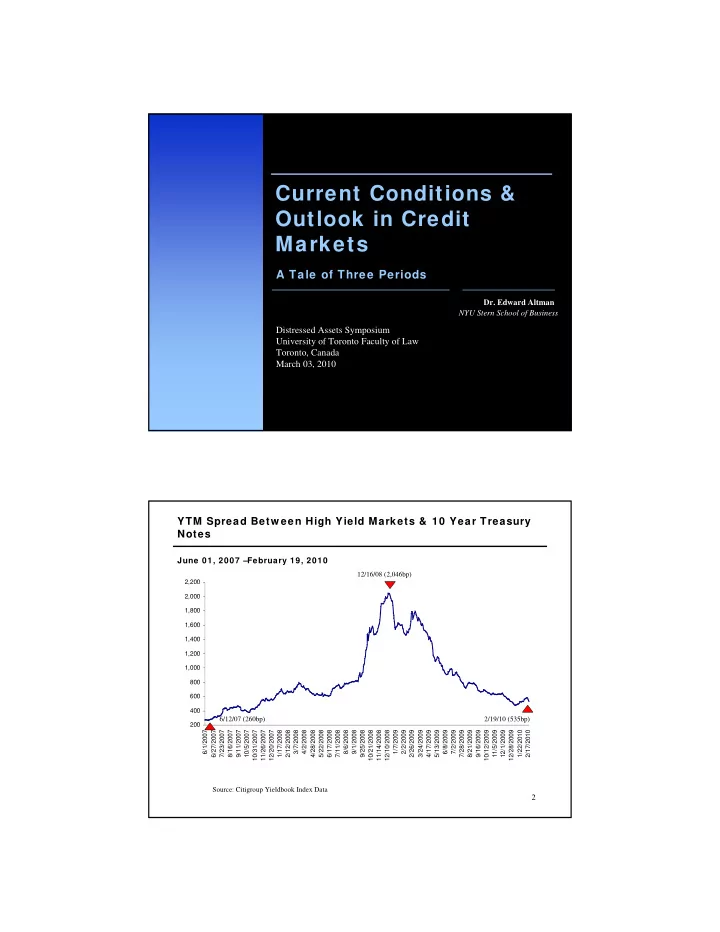
YTM Spread Betw een High Yield Markets & 10 Year Treasury Notes

June 01, 2007 –February 19, 2010

Source: Citigroup Yieldbook Index Data

200 400 600 800 1,000 1,200 1,400 1,600 1,800 2,000 2,200 6/1/2007 6/27/2007 7/23/2007 8/16/2007 9/11/2007 10/5/2007 10/31/2007 11/26/2007 12/20/2007 1/17/2008 2/12/2008 3/7/2008 4/2/2008 4/28/2008 5/22/2008 6/17/2008 7/11/2008 8/6/2008 9/1/2008 9/25/2008 10/21/2008 11/14/2008 12/10/2008 1/7/2009 2/2/2009 2/26/2009 3/24/2009 4/17/2009 5/13/2009 6/8/2009 7/2/2009 7/28/2009 8/21/2009 9/16/2009 10/12/2009 11/5/2009 12/1/2009 12/28/2009 1/22/2010 2/17/2010

6/12/07 (260bp) 12/16/08 (2,046bp) 2/19/10 (535bp)

slide-2
SLIDE 2

3

Default and Recovery Forecasting Models

Macro-Economic Models: Default Probabilities Mortality Rate Models: Default Probabilities Market Based Models: Default Probabilities Recovery Rate Models: Loss-Given-Default Distressed Debt Market Size Estimate

4

Historical Default Rates and Recession Periods in the U.S.

Periods of Recession: 11/73 - 3/75, 1/80 - 7/80, 7/81 - 11/82, 7/90 - 3/91, 4/01 – 12/01, 12/07-present Source: E. Altman (NYU Salomon Center) & National Bureau of Economic Research

HIGH YIELD BOND MARKET 1972 – 2009

0.0% 2.0% 4.0% 6.0% 8.0% 10.0% 12.0% 14.0% 72 74 76 78 80 82 84 86 88 90 92 94 96 98 00 02 04 06 08

slide-3
SLIDE 3

5

Major Agencies Bond Rating Categories

Moody's S&P/Fitch Aaa AAA Aa1 AA+ Aa2 AA Aa3 AA- A1 A+ A2 A A3 A- Baa1 BBB+ Baa2 Investment BBB Baa3 Grade BBB- Ba1 High Yield BB+ Ba2 ("Junk") BB Ba3 BB- B1 B+ B2 B B3 B- Caa1 CCC+ Caa CCC Caa3 CCC- Ca CC C C D

6

1978 – 2009 (Mid-year US$ billions)

Size of the US High-Yield Bond Market

$- $200 $400 $600 $800 $1,000 $1,200 $1,400 1 9 7 8 1 9 7 9 1 9 8 1 9 8 1 1 9 8 2 1 9 8 3 1 9 8 4 1 9 8 5 1 9 8 6 1 9 8 7 1 9 8 8 1 9 8 9 1 9 9 1 9 9 1 1 9 9 2 1 9 9 3 1 9 9 4 1 9 9 5 1 9 9 6 1 9 9 7 1 9 9 8 1 9 9 9 2 2 1 2 2 2 3 2 4 2 5 2 6 2 7 2 8 2 9 $ Billions $1,153

slide-4
SLIDE 4

7

Par Value Par Value Default Year Outstanding* Defaults Rates (%) 2009 $1,152,952 $123,824 10.740% 2008 $1,091,000 $50,169 4.598 2007 $1,075,400 $5,473 0.509 2006 $993,600 $7,559 0.761 2005 $1,073,000 $36,181 3.372 2004 $933,100 $11,657 1.249 2003 $825,000 $38,451 4.661 2002 $757,000 $96,855 12.795 2001 $649,000 $63,609 9.801 2000 $597,200 $30,295 5.073 1999 $567,400 $23,532 4.147 1998 $465,500 $7,464 1.603 1997 $335,400 $4,200 1.252 1996 $271,000 $3,336 1.231 1995 $240,000 $4,551 1.896 1994 $235,000 $3,418 1.454 1993 $206,907 $2,287 1.105 1992 $163,000 $5,545 3.402 1991 $183,600 $18,862 10.273 1990 $181,000 $18,354 10.140 1989 $189,258 $8,110 4.285 1988 $148,187 $3,944 2.662 1987 $129,557 $7,486 5.778 1986 $90,243 $3,156 3.497 1985 $58,088 $992 1.708 2010 (2/12) $1,1,82,995 $1,268 0.107%

Straight Bonds Only Excluding Defaulted Issues From Par Value Outstanding, (US$ millions) 1971 – 2010 (February 12th)

Historical Default Rates

Par Value Par Value Default Year Outstandinga Defaults Rates (%) 1984 $40,939 $344 0.840 1983 $27,492 $301 1.095 1982 $18,109 $577 3.186 1981 $17,115 $27 0.158 1980 $14,935 $224 1.500 1979 $10,356 $20 0.193 1978 $8,946 $119 1.330 1977 $8,157 $381 4.671 1976 $7,735 $30 0.388 1975 $7,471 $204 2.731 1974 $10,894 $123 1.129 1973 $7,824 $49 0.626 1972 $6,928 $193 2.786 1971 $6,602 $82 1.242 Standard Deviation (%) Arithmetic Average Default Rate 1971 to 2009 3.331% 3.224% 1978 to 2009 3.636% 3.422% 1985 to 2009 4.322% 3.548% Weighted Average Default Rate* 1971 to 2009 4.550% 1978 to 2009 4.561% 1985 to 2009 4.598% Median Annual Default Rate 1971 to 2009 1.896% Source: Author’s compilation and Citigroup estimate * Weighted by par value of amount outstanding for each year.

8

Historical Default Rates

QUARTERLY DEFAULT RATE AND FOUR QUARTER MOVING AVERAGE 1991 – 2010 (February 12th)

Source: Author’s Compilations

0.0% 1.0% 2.0% 3.0% 4.0% 5.0% 6.0% 1989 1990 1991 1992 1993 1994 1995 1996 1997 1998 1999 2000 2001 2002 2003 2004 2005 2006 2007 2008 2009 1Q10 Quarterly Default Rate 0.0% 2.0% 4.0% 6.0% 8.0% 10.0% 12.0% 14.0% 16.0% 4 - Quarter Moving Average

Quarterly Moving

slide-5
SLIDE 5

9

High-Yield Bond Distressed Exchange Default & Recovery Statistics

1984 –2010 (Feb. 12 th)

Source: Authors’ Compilations

Year Distressed Exchange Defaults ($) Total Defaults ($) % Distressed Exchange Defaults to Total ($) Distressed Exchange Defaults (# Issuers) Total Defaults (# Issuers) % Distressed Exchange Defaults to Total (# Issuers) Distressed Exchange Recovery Rate All Default Recovery Rate Difference Between Distressed Exchange & All Default Recovery Rate

2010 269.80 1,267.66 21.3% 1 6 16.7% n/a 38.49 n/a 2009 22,905.90 123,823.79 18.5% 45 119 37.8% 42.68 36.13 6.55 2008 30,329.42 50,763.26 59.7% 14 64 21.9% 52.41 42.50 9.91

2007 146.83 5,473.00 2.7% 1 19 5.3% 85.17 66.65 18.52 2006 0.00 7,559.00 0.0% 0.0% n/a n/a n/a 2005 6,861.00 36,209.00 18.9% 1 34 2.9% 78.61 62.96 15.65 2004 537.88 11,657.00 4.6% 5 39 12.8% 58.05 57.72 0.33 2003 1,080.12 38,451.00 2.8% 8 86 9.3% 78.52 45.58 32.94 2002 764.80 96,858.00 0.8% 3 112 2.7% 61.22 25.3 35.92 2001 1,267.60 63,609.00 2.0% 5 156 3.2% 33.12 25.62 7.50 2000 50.00 30,295.00 0.2% 1 107 0.9% 77.00 26.74 50.26 1999 2,118.40 23,532.00 9.0% 6 98 6.1% 65.39 27.9 37.49 1998 461.10 7,464.00 6.2% 2 37 5.4% 17.34 40.46 (23.12) 1997 0.00 4,200.00 0.0% 0.0% n/a n/a n/a 1996 0.00 3,336.00 0.0% 0.0% n/a n/a n/a 1995 0.00 4,551.00 0.0% 0.0% n/a n/a n/a 1994 0.00 3,418.00 0.0% 0.0% n/a n/a n/a 1993 0.00 2,287.00 0.0% 0.0% n/a n/a n/a 1992 0.00 5,545.00 0.0% 0.0% n/a n/a n/a 1991 76.00 18,862.00 0.4% 1 62 1.6% 31.30 40.67 (9.37) 1990 1,044.00 18,354.00 5.7% 7 47 14.9% 43.15 24.66 18.49 1989 548.90 8,110.00 6.8% 6 26 23.1% 44.53 35.97 8.56 1988 390.30 3,944.00 9.9% 3 24 12.5% 28.40 43.45 (15.05) 1987 33.60 7,486.00 0.4% 2 15 13.3% 40.70 66.63 (25.93) 1986 114.80 3,156.00 3.6% 3 23 13.0% 47.68 36.6 11.08 1985 323.30 992.00 32.6% 2 19 10.5% 55.04 41.78 13.26 1984 100.10 344.00 29.1% 1 12 8.3% 44.12 50.62 (6.50)

Totals/Averages 69,423.84 581,546.71 11.9% 117 1105 10.6% 51.81 41.82 9.82

10 10 10

Lagging Tw Lagging Tw elve-Month Lever elve-Month Leveraged Loan Default Rate aged Loan Default Rate by Principal by Principal Amount & Amount & Number of Issuers Number of Issuers

aDefault rate is calculated as the amount defaulted over the last twelve months divided by the amount outstanding at the beginning of the twelve-

month period. bDefault rate is calculated as the number of defaults over the last twelve months divided by the number of issuers in the Index at the beginning of the twelve-month period.

Source: S&P LCD January 29, 2009 8.82% January 29, 2009 8.18% Lagging 12-months Default Rate by Principal Amounta 0% 2% 4% 6% 8% 10% 12% D e c

  • 9

8 J u n

  • 9

9 D e c

  • 9

9 J u n

  • D

e c

  • J

u n

  • 1

D e c

  • 1

J u n

  • 2

D e c

  • 2

J u n

  • 3

D e c

  • 3

J u n

  • 4

D e c

  • 4

J u n

  • 5

D e c

  • 5

J u n

  • 6

D e c

  • 6

J u n

  • 7

D e c

  • 7

J u n

  • 8

D e c

  • 8

J u n

  • 9

D e c

  • 9

Lagging 12-months Default Rate by Number of Issuersb 0% 1% 2% 3% 4% 5% 6% 7% 8% 9% D e c

  • 9

8 J u n

  • 9

9 D e c

  • 9

9 J u n

  • D

e c

  • J

u n

  • 1

D e c

  • 1

J u n

  • 2

D e c

  • 2

J u n

  • 3

D e c

  • 3

J u n

  • 4

D e c

  • 4

J u n

  • 5

D e c

  • 5

J u n

  • 6

D e c

  • 6

J u n

  • 7

D e c

  • 7

J u n

  • 8

D e c

  • 8

J u n

  • 9

D e c

  • 9
slide-6
SLIDE 6

11

2009 High-Yield and Institutional Leveraged Loan Defaults

8,804 8,125 16,929 2,551 8,218 10,769 16,698 23,513 40,211 2,031 18,952 20,983 6,030 10,690 16,721 3,559 14,215 17,773 3,694 2,617 6,311 1,781 6,061 7,842 609 924 1,533 6,679 6,745 13,424 893 23,407 24,300 1,854 357 2,212

5,000 10,000 15,000 20,000 25,000 30,000 35,000 40,000 45,000 ($ millions) Jan- 09 Feb- 09 Mar- 09 Apr- 09 May- 09 Jun- 09 Jul- 09 Aug- 09 Sep- 09 Oct- 09 Nov- 09 Dec- 09 Loan Defaults Bond Defaults Combined

Sources: S&P LCD and E. Altman, NYU Salomon Center.

12

Largest High-Yield and Institutional Leveraged Loan Defaults*

2009

13,833 13,833 n/a 10/25/2009 Capmark Financial Group, Inc. 2,362 1,500 862 05/27/2009 Visteon Corp. 2,792 517 2,275 01/26/2009 Smurfit-Stone Container Corp. 3,025 n/a 3,025 01/14/2009 Nortel Networks Ltd. 3,041 n/a 3,041 03/10/2009 Freescale Semiconductor, Inc. 3,354 n/a 3,354 04/03/2009 Ford Motor Co. 5,263 n/a 5,263 04/16/2009 Abitibi Bowater, Inc. 5,551 n/a 5,551 04/01/2009 Harrah’s Operating Co., Inc. 8,766 2,685 6,081 05/28/2009 R.H. Donnelley Corp. 9,020 6,170 2,850 03/31/2009 Idearc, Inc. 9,124 7,493 1,631 01/06/2009 Lyondell Basell 11,925 1,466 10,459 06/01/2009 General Motors Corp. 20,092 7,281 12,811 03/27/2009 Charter Communications Holdings, LLC 37,158 15,225 21,933 11/01/2009 CIT Group, Inc. Combined Defaults ($ million) Loan Defaults ($ million) Bond Defaults ($ million) Date Issuer

*Includes only those defaults where a company’s combined bond and loan defaults totaled more than $1.0 billion in a given month.

slide-7
SLIDE 7

13

Largest High-Yield and Institutional Leveraged Loan Defaults*

(continued)

2009

1,224 n/a 1,224 02/02/2009 Vitro SAB de CV 1,020 n/a 1,020 03/18/2009 Chemtura Corp. 2,250 n/a 2,250 04/16/2009 Rouse Co. 2,300 n/a 2,300 02/01/2009 Station Casinos, Inc. 1,375 700 675 06/09/2009 Fontainebleau Las Vegas Holdings, LLC 1,385 985 400 07/07/2009 Lear Corp. 1,571 n/a 1,571 05/01/2009 Thornburg Mortgage, Inc. 1,682 835 847 06/01/2009 Six Flags, Inc. 1,740 n/a 1,740 08/19/2009 E Trade Financial Corp. 1,783 1,183 600 08/24/2009 Reader’s Digest Association, Inc. 1,899 1,129 770 03/16/2009 Masonite Corp. 1,911 809 1,102 02/12/2009 Aleris International, Inc. 1,988 1,988 n/a 03/16/2009 General Growth Properties 2,057 1,024 1,033 02/03/2009 Spectrum Brands, Inc. Combined Defaults ($ million) Loan Defaults ($ million) Bond Defaults ($ million) Date Issuer

*Includes only those defaults where a company’s combined bond and loan defaults totaled more than $1.0 billion in a given month. Sources: S&P LCD and E. Altman, NYU Salomon Center

14 14 14

Filings for Chapter 11

Number of Filings and Pre-petition Liabilities of Public Companies

1989 – 2009

Note: Minimum $100 million in liabilities Source: NYU Salomon Center Bankruptcy Filings Database $0 $100 $200 $300 $400 $500 $600 $700 $800 89 90 91 92 93 94 95 96 97 98 99 00 01 02 03 04 05 06 07 08 (Excl. LEH) 08 (Incl. LEH) 2009 $ Billion 40 80 120 160 200 240 280 Pre- Petition Liabilities, in $ billions (left axis) Number of Filings (right axis) 2009 234 filings and liabilities of $604.0 billion 2008 Excluding Lehman Brothers 145 filings and liabilities of $107.8 billion Including Lehman Brothers 146 filings and liabilities of $720.8 billion

slide-8
SLIDE 8

15 15 15

Forecasting Default and Recovery Rates

16 16 16

Method 1: Recession Scenario Analysis

Rating Distributions Prior To Recessions

(Percent of Issuers)

Subsequent Default Rates By Rating Category

1991 2001 2009 Forecasts 1991/2001 Scenarios 2010 (Q4) Forecasts 1991/2001 Scenarios Ba/BB 4% 2% 1.7% / 0.9% 1.3% / 0.7% B/B 16% 11% 5.6% / 3.9% 7.8% / 5.4% Caa/CCC/C C 37% 34% 8.1% / 7.5% 6.7% / 6.1% H.Y. Default Rate 11.0% 10.6% 15.4% / 12.3% 15.8% / 12.2%

1Based on Moody’s & S&P ratings in 2008 and 2009 (4Q).

Source: M. Friedson: Distressed Debt Investor (September 28, 2006, April 17, 2008) and author updates.

1990 2000 20081 2009 (Q4) Ba/BB 54% 32% 43% 33% B/B 44% 54% 35% 49% Caa+Ca/C CCC/CC 2% 14% 22% 18%

slide-9
SLIDE 9

17 17 17

New Issues Rated B- or Below as Percentage of all New Issues (1993 – 2009)

Source: Standard & Poor’s Global Fixed Income Research 26.0% 22.0% 28.0% 26.0% 32.0% 38.0% 30.0% 31.0% 21.0% 21.0% 31.0% 42.5% 42.0% 42.4% 49.2% 19.0% 21.5%

0.0% 10.0% 20.0% 30.0% 40.0% 50.0% 60.0% 1 9 9 3 1 9 9 4 1 9 9 5 1 9 9 6 1 9 9 7 1 9 9 8 1 9 9 9 2 2 1 2 2 2 3 2 4 2 5 2 6 2 7 2 8 2 9

Method 2: Mortalit Method 2: Mortality Rate Analysis y Rate Analysis

18 18 18

Source: Altman Mortality Tables (1971‐2009) Source: Altman Mortality Tables (1971‐2009)

Default Lag After Issuance: ‘B’ & ‘CCC’ Rated Corporate Bonds

3.08% 8.05% 8.08% 8.18% 6.11% 4.78% 3.85% 2.35% 1.94% 0.96% 0.0% 1.0% 2.0% 3.0% 4.0% 5.0% 6.0% 7.0% 8.0% 9.0% 1 2 3 4 5 6 7 8 9 10

Years after Issuance Default Rate

Default Lag after Issuance for ‘B’ Ratings

8.78% 13.02% 18.68% 16.34% 4.64% 12.15% 5.65% 5.11% 0.77% 4.59% 0.0% 2.0% 4.0% 6.0% 8.0% 10.0% 12.0% 14.0% 16.0% 18.0% 20.0% 1 2 3 4 5 6 7 8 9 10

Years after Issuance Default Rate

Default Lag after Issuance for ‘CCC’ Ratings

slide-10
SLIDE 10

19 19 19

Forecasting Defaults and the Default Rate

MODEL DRIVERS

  • Mortality Rate Estimates: 1971 - 2009

= f {bond rating, age, redemptions, defaults}

  • Historical New Issuance over last 10 years by credit

quality

  • Bond-ratings
  • Z-score Bond-equivalent ratings
  • Estimate high yield market growth in 2010

New Defaults and Default Rate in 2010

20 20 20

Marginal and Cumulative Mortality Rate Equation

One can measure the cumulative mortality rate (CMR) over a specific time period (1,2,…, T years) by subtracting the product of the surviving populations of each of the previous years from one (1.0), that is, MMR(t) = Total value of defaulting debt in year (t) total value of the population at the start of the year (t)

MMR = Marginal Mortality Rate

CMR(t) = 1 - Π SR(t) , t = 1 here CMR (t) = Cumulative Mortality Rate in (t), SR (t) = Survival Rate in (t) , 1 - MMR (t)

slide-11
SLIDE 11

21 21 21

All Rated Corporate Bonds* 1971-2009

Mortality Rates by Original Rating

*Rated by S&P at Issuance Based on 2,527 issues Source: Standard & Poor's (New York) and Author's Compilation

1 2 3 4 5 6 7 8 9 10 AAA Marginal 0.00% 0.00% 0.00% 0.00% 0.03% 0.02% 0.01% 0.00% 0.00% 0.00% Cumulative 0.00% 0.00% 0.00% 0.00% 0.03% 0.05% 0.06% 0.06% 0.06% 0.06% AA Marginal 0.00% 0.00% 0.27% 0.12% 0.02% 0.01% 0.00% 0.01% 0.03% 0.01% Cumulative 0.00% 0.00% 0.27% 0.39% 0.41% 0.42% 0.42% 0.43% 0.46% 0.47% A Marginal 0.01% 0.08% 0.18% 0.19% 0.15% 0.12% 0.05% 0.22% 0.12% 0.08% Cumulative 0.01% 0.09% 0.27% 0.46% 0.61% 0.73% 0.78% 1.00% 1.11% 1.19% BBB Marginal 0.42% 2.86% 1.48% 1.12% 0.68% 0.30% 0.36% 0.19% 0.18% 0.38% Cumulative 0.42% 3.27% 4.70% 5.77% 6.41% 6.69% 7.02% 7.20% 7.37% 7.72% BB Marginal 1.09% 2.23% 4.11% 2.18% 2.58% 1.50% 1.57% 1.20% 1.63% 3.30% Cumulative 1.09% 3.30% 7.27% 9.29% 11.63% 12.96% 14.32% 15.35% 16.73% 19.48% B Marginal 3.08% 8.05% 8.08% 8.18% 6.11% 4.78% 3.85% 2.35% 1.94% 0.96% Cumulative 3.08% 10.88% 18.08% 24.78% 29.38% 32.76% 35.34% 36.86% 38.09% 38.68% CCC Marginal 8.78% 13.02% 18.68% 16.34% 4.64% 12.15% 5.65% 5.11% 0.77% 4.59% Cumulative 8.78% 20.66% 35.48% 46.02% 48.53% 54.78% 57.33% 59.51% 59.83% 61.67%

22 22 22

All Rated Corporate Bonds* 1971-2009

Mortality Losses by Original Rating

*Rated by S&P at Issuance Based on 2,099 issues Source: Standard & Poor's (New York) and Author's Compilation

1 2 3 4 5 6 7 8 9 10 AAA Marginal 0.00% 0.00% 0.00% 0.00% 0.01% 0.01% 0.01% 0.00% 0.00% 0.00% Cumulative 0.00% 0.00% 0.00% 0.00% 0.01% 0.02% 0.03% 0.03% 0.03% 0.03% AA Marginal 0.00% 0.00% 0.04% 0.04% 0.01% 0.01% 0.00% 0.01% 0.01% 0.01% Cumulative 0.00% 0.00% 0.04% 0.08% 0.09% 0.10% 0.10% 0.11% 0.12% 0.13% A Marginal 0.00% 0.03% 0.09% 0.15% 0.09% 0.05% 0.03% 0.05% 0.08% 0.03% Cumulative 0.00% 0.03% 0.12% 0.27% 0.36% 0.41% 0.44% 0.49% 0.57% 0.60% BBB Marginal 0.33% 1.92% 1.26% 0.45% 0.44% 0.20% 0.15% 0.11% 0.11% 0.22% Cumulative 0.33% 2.24% 3.48% 3.91% 4.33% 4.52% 4.67% 4.77% 4.88% 5.09% BB Marginal 0.63% 1.29% 2.43% 1.27% 1.54% 0.79% 0.86% 0.52% 0.84% 1.18% Cumulative 0.63% 1.91% 4.30% 5.51% 6.97% 7.70% 8.49% 8.97% 9.74% 10.80% B Marginal 2.06% 5.63% 5.48% 5.46% 4.03% 2.63% 2.50% 1.32% 1.00% 0.69% Cumulative 2.06% 7.57% 12.64% 17.41% 20.74% 22.82% 24.75% 25.74% 26.49% 26.99% CCC Marginal 5.78% 9.34% 13.28% 11.95% 3.28% 9.15% 4.26% 3.96% 0.47% 2.94% Cumulative 5.78% 14.58% 25.92% 34.78% 36.92% 42.69% 45.13% 47.30% 47.55% 49.09%

slide-12
SLIDE 12

23 23 23

Mortality Rate Based Method Forecasts of Default and Recovery Rates in the High-Yield Bond Market

2007 - 2010 Year Default Rate Default Amount ($ billion) Recovery Rate* 2008 (Forecast) 4.64% $53.1 39.6% 2008 (Actual) 4.60% $50.2 42.5% 2009 (Forecast) 7.98% $92.0 30.0% 2009 (Actual) 10.74% $123.8 36.1% 2010 (Forecast) 5.06% $62.5 34.9%

Source: Mortality Rates (Slide 25), All Corporate Bond Issuance and Authors’ Estimates of Market Size in 2010.

*Based on the log-linear default rate/recovery rate regression.

24 24 24

Methods 3 & 4:

Market Based Measures Market Based Measures

slide-13
SLIDE 13

25 25 25 25

Case 1: Default Rate[t+1] Versus Yield S pread[t]

The regression equation is Default Rate = - 3.25 + 1.39 * Spread Predictor Coef S E Coef T P Constant -3.2490 0.9072 -3.58 0.001 S pread 1.3904 0.1741 7.99 0.000 S = 1.86079 R-S q = 69.5% R-S q(adj ) = 68.4%

Application Applying Yield spread (12/ 31/ 2007) of 566 bps, PD = -3.25 + 1.39*5.66 = 4.617% Applying Yield spread (12/ 31/ 2008) of 1,731 bps, PD = -3.25 + 1.39*17.31 = 20.811% Applying Yield spread (12/ 31/ 2009) of 513 bps, PD = -3.25 + 1.39*5.13 = 3.883%

Dollar Denominated (Altman) Default Rate Predictions

26 26 26 26

Case 2: Default Rate[t+1] Versus Distress Ratio[t]

The regression equation is Default Rate = 0.942 + 0.190 * Distress Ratio Predictor Coef S E Coef T P Constant 0.9422 0.7596 1.24 0.233 Distress Ratio 0.19045 0.03579 5.32 0.000 S = 2.24391 R-S q = 63.9% R-S q(adj ) = 61.6%

Application Applying Distress Ratio (12/ 31/ 2007) of 10.42% , PD = 0.810 + 0.193*10.42 = 2.820% Applying Distress Ratio (12/ 31/ 2008) of 82.00% , PD = 0.810 + 0.193*82.00 = 16.636% Applying Distress Ratio (12/ 31/ 2009) of 15.30% , PD = 0.942 + 0.190 *15.30 = 3.856%

Dollar Denominated (Altman) Default Rate Predictions

slide-14
SLIDE 14

27 27

Default and Recovery Forecasts: Summary of Forecast Models

Model 2009 Default Rate Forecast as

  • f 12/31/2008

12/31/2010 Recession Default Rate Forecast as

  • f 12/31/2009

12/31/2010 No Recession Default Rate Forecast as

  • f 12/31/2009

Mortality Rate 7.98% 5.06% 5.06% Recession Scenarios 15.40% 14.00% n/r Yield-Spread 18.32% 3.89%** 3.89%** Distress Ratio 14.16% 3.86%*** 3.86%*** Average of Models (Recovery Rates)* 13.63% (24.3%) 6.70% (31.8%) 4.27% (36.7%)

Source: All Corporate Bond Issuance and Authors’ Estimates of Market Size in 2010. * Recovery rate based on the log Linear equation between default and recovery rates, see Altman, et al (2005) Journal of Business, November and Slide 36. *Based on Dec. 31, 2009 yield-spread of 513.16bp.***Based on Dec. 31, 2009 Distress Ratio of 15.3%.

28

Upcoming Debt Maturities

High-Yield Bond, Leveraged Loan and Commercial Mortgage Maturities ($ in billions)

________________________________________________

Source: J.P. Morgan; S&P LCD.

27 63 64 81 109 118 101 77 52 95 205 168 188 211 236 265 270 45 21 2 10 4 14

100 200 300 400 500 600 2009 2010 2011 2012 2013 2014 2015 2016 2017 $Billion

High Yield Leveraged Loans Commercial Mortgages

slide-15
SLIDE 15

29 29

A Credit Default A Credit Default Analysis of LBOs Analysis of LBOs

30

Source: Standard and Poor’s LCD

Purchase Price Multiple excluding Fees for LBO Transactions

Purchase Price Multiples Purchase Price Multiples

9.3 8.7 7.5 7.0 8.3 9.9 8.8 6.8 7.3 8.1 8.0 9.1 8.7 7.8 7.4 8.1

0.0 4.0 8.0 12.0

1980- 1989 1987 1988 1989 2003 2004 2005 2006 2007 2008 2009

Public-to-Private All Other

NA

slide-16
SLIDE 16

31

Av Avera erage Tot ge Total Debt Le l Debt Levera verage Ratio for LBO’s: ge Ratio for LBO’s: Eur Europe and US w ith and US w ith EBITDA of EBITDA of €/$5 $50M or 0M or More More

Source: Standard & Poor’s LCD 4.7 4.4 4.3 4.4 4.5 4.8 5.5 5.8 6.6 5.3 4.5 4.9 4.3 4.1 4.1 4.7 4.9 5.4 5.5 6.2 4.9 4.0 0.0x 1.0x 2.0x 3.0x 4.0x 5.0x 6.0x 7.0x 1999 2000 2001 2002 2003 2004 2005 2006 2007 2008 2009 Europe US

32

Average Equity Contri Average Equity Contribution to Leveraged bution to Leveraged Buyouts Buyouts

1987 – 1987 – 4Q09 Q09

5.5% 2.3% 2.3% 2.1 % 3.8% 0.0%

7.0% 9.7% 13.4% 20.7%22.0% 25.2%26.2% 23.7%22.9% 30.0%31.7% 35.7% 37.8% 40.6%40.0%39.5% 35.1% 32.9% 42.6% 51.9% 47.7%

3.5% 3.3% 3.9% 4.1 % 2.7% 4.7% 2.7% 5.7%

32.1% 33.3%

0% 10% 20% 30% 40% 50% 60%

1987 1988 1989 1990 1992 1993 1994 1995 1996 1997 1998 1999 2000 2001 2002 2003 2004 2005 2006 2007 2008 2009 4Q09

Equity as a Percent of Total Sources Rollover Equity Contributed Equity

Equity includes common equity and preferred stock as well as holding company debt and seller note proceeds downstreamed to the operating company as common equity; Rollover Equity prior to 1996 is not available; There were too few deals in 1991 to form a meaningful sample. Source: Standard & Poor’s LCD

slide-17
SLIDE 17

33 33

New Research: Mortality Rate Analysis for LBOs

2000 - 2009

34 34

Recovery Rate Analysis

slide-18
SLIDE 18

35 35 35

Default Rates and Lossesa

1978 – 2010 (Feb. 12th)

Par Value Par Value Outstandinga Of Default Default Weighted Price Weighted Default Year ($MM) ($MMs) Rate (%) After Default Coupon (%) Loss (%) 2010 (2/12)$1,182,995 $1,268 0.11 38.5 9.05 0.07 2009 $1,152,952 $123,824 10.74 $36.1 8.16 7.30 2008 $1,091,000 $50,169 4.60 $42.5 8.23 2.83 2007 $1,075,400 $5,473 0.51 $66.6 9.64 0.19 2006 $993,600 $7,559 0.76 $65.3 9.33 0.30 2005 $1,073,000 $36,181 3.37 $61.1 8.61 1.46 2004 $933,100 $11,657 1.25 $57.7 10.30 0.61 2003 $825,000 $ 38,451 4.66 $45.5 9.55 2.76 2002 $757,000 $96,858 12.79 $25.3 9.37 10.15 2001 $649,000 $63,609 9.80 $25.5 9.18 7.76 2000 $597,200 $30,248 5.06 $26.4 8.54 3.94 1999 $567,400 $23,532 4.15 $27.9 10.55 3.21 1998 $465,500 $7,464 1.60 $35.9 9.46 1.10 1997 $335,400 $4,200 1.25 $54.2 11.87 0.65 1996 $271,000 $3,336 1.23 $51.9 8.92 0.65 1995 $240,000 $4,551 1.90 $40.6 11.83 1.24 1994 $235,000 $3,418 1.45 $39.4 10.25 0.96 1993 $206,907 $2,287 1.11 $56.6 12.98 0.56 1992 $163,000 $5,545 3.40 $50.1 12.32 1.91 1991 $183,600 $18,862 10.27 $36.0 11.59 7.16 1990 $181,000 $18,354 10.14 $23.4 12.94 8.42 1989 $189,258 $8,110 4.29 $38.3 13.40 2.93 1988 $148,187 $3,944 2.66 $43.6 11.91 1.66 1987 $129,557 $7,486 5.78 $75.9 12.07 1.74 1986 $90,243 $3,156 3.50 $34.5 10.61 2.48 1985 $58,088 $992 1.71 $45.9 13.69 1.04 1984 $40,939 $344 0.84 $48.6 12.23 0.48 1983 $27,492 $301 1.09 $55.7 10.11 0.54 1982 $18,109 $577 3.19 $38.6 9.61 2.11 1981 $17,115 $27 0.16 $12.0 15.75 0.15 1980 $14,935 $224 1.50 $21.1 8.43 1.25 1979 $10,356 $20 0.19 $31.0 10.63 0.14 1978 $8,946 $119 1.33 $60.0 8.38 0.59 Arithmetic Average 1978-2009: 3.63 $44.79 10.64 2.45 Weighted Average 1978-2009: 4.56 3.09

a Excludes defaulted issues..

Source: Authors’ compilations and various dealer price quotes.

36 36 36

Source: E. Altman, et. al., “The Link Between Default and Recovery Rates”, NYU Salomon Center, S-03-4.

2010 2005 2004 2003 2002 2001 2000 1999 1998 1997 1996 1995 1994 1993 1992 1991 1990 1989 1988 1987 1986 1985 1984 1983 1982 2006 2007 20 2008 08 2009 y = -2.3137x + 0.5029 R

2 = 0.5361

y = -0.1069Ln(x) + 0.0297 R

2 = 0.6287

y = 30.255x

2 - 6.0594x + 0.5671

R

2 = 0.6151

y = 0.1457x

  • 0.2801

R

2 = 0.6531

10% 20% 30% 40% 50% 60% 70% 80% 0% 2% 4% 6% 8% 10% 12% 14%

Recovery Rate Recovery Rate/Default Rate Association

Dollar Weighted Average Recovery Rates to Dollar Weighted Average Default Rates (1982-2010 (Feb. 12th))

slide-19
SLIDE 19

37 37 37

2001 5.44 4.01 1.43 12.31 5.04 7.27 2000 (5.68) 14.45 (20.13) 14.56 5.12 9.44 1999 1.73 (8.41) 10.14 11.41 6.44 4.97 1998 4.04 12.77 (8.73) 10.04 4.65 5.39 1997 14.27 11.16 3.11 9.20 5.75 3.45 1996 11.24 0.04 11.20 9.58 6.42 3.16 1995 22.40 23.58 (1.18) 9.76 5.58 4.18 1994 (2.55) (8.29) 5.74 11.50 7.83 3.67 1993 18.33 12.08 6.25 9.08 5.80 3.28 1992 18.29 6.50 11.79 10.44 6.69 3.75 1991 43.23 17.18 26.05 12.56 6.70 5.86 1990 (8.46) 6.88 (15.34) 18.57 8.07 10.50 1989 1.98 16.72 (14.74) 15.17 7.93 7.24 1988 15.25 6.34 8.91 13.70 9.15 4.55 1987 4.57 (2.67) 7.24 13.89 8.83 5.06 1986 16.50 24.08 (7.58) 12.67 7.21 5.46 1985 26.08 31.54 (5.46) 13.50 8.99 4.51 1984 8.50 14.82 (6.32) 14.97 11.87 3.10 1983 21.80 2.23 19.57 15.74 10.70 5.04 1982 32.45 42.08 (9.63) 17.84 13.86 3.98 1981 7.56 0.48 7.08 15.97 12.08 3.89 1980 (1.00) (2.96) 1.96 13.46 10.23 3.23 1979 3.69 (0.86) 4.55 12.07 9.13 2.94 1978 7.57 (1.11) 8.68 10.92 8.11 2.81 Arithmetic Annual ithmetic Annual Average Average 1978-2009 1978-2009 11.00 11.00 8.34 2.66 8.34 2.66 12.22 12.22 6.99 5.23 6.99 5.23 Compound Annual Compound Annual Average Average 1978-2009 1978-2009 9.97 7.75 9.97 7.75 2.22 2.22

a End-of-year yields.

Source: Citigroup’s High Yield Composite Index 2010 (2/19) 0.71 1.03 (0.32) 9.13 3.78 5.35 2009 55.19 (9.92) 65.11 8.97 3.84 5.14 2008 (25.91) 20.30 (46.21) 19.53 2.22 17.31 2007 1.83 9.77 (7.95) 9.69 4.03 5.66 2006 11.85 1.37 10.47 7.82 4.70 3.11 2005 2.08 2.04 0.04 8.44 4.39 4.05 2004 10.79 4.87 5.92 7.35 4.21 3.14 2003 30.62 1.25 29.37 8.00 4.26 3.74 2002 (1.53) 14.66 (16.19) 12.38 3.82 8.56

Annual Returns

Yields and Spreads on 10-Year Treasury (Treas) and High Yield (HY) Bonds

1978 – 2010 (Feb. 19th)

Return (%) Promised Yield (%)a Year HY Treas Spread HY Treas Spread

38 38 38

Size of Distressed Debt Market

slide-20
SLIDE 20

39 39 39

(a) Defined as yield-to-maturity spread greater than or equal to 1000bp over comparable Treasuries. (b) $1.463 trillion as of 12/31/2009. (c) Some years not available as no survey results available. Source: NYU Salomon Center

Distresseda And Defaulted Debt as a Percentage of High Yield And Defaulted Debt Marketsb

1990 – 2009

14% 26% 15% 7% 5% 7% 13% 19% 18% 14% 14% 13% 10% 18% 19% 28% 17% 8% 6% 3% 9% 31% 22% 21% 5% 3% 4% 1% 9% 67% 12% 2% 0% 10% 20% 30% 40% 50% 60% 70% 80% 90% 1990 1992 1993 1995 1998 1999 2000 2001 2002 2003 2004 2005 2006 2007 2008 2009

Defaulted Distressed

40 40 40

Estimated Face And Market Values Of Defaulted And Distressed Debt ($ Billions)

2006 – 2009

Face Value Market Value 12/31/2007 12/31/2008 12/31/2009 12/31/2007 12/31/2008 12/31/2009 Market/Face Ratio Public Debt Defaulted 127.3 $ 234.4 $ 279.6 $

(1)

76.4 $ 40.7 $ 97.8 $ 0.35 Distressed 113.6 $ 888.5 $ 181.0 $

(2)

85.2 $ 488.7 $ 135.7 $ 0.75 Total Public 240.9 $ 1,122.9 $ 460.6 $ 161.6 $ 529.4 $ 233.6 $ Private Debt Defaulted 331.0 $ 515.6 $ 698.9 $

(3)

281.4 $ 299.1 $ 419.3 $ 0.60 Distressed 295.3 $ 1,954.8 $ 452.5 $

(3)

265.7 $ 1,368.3 $ 362.0 $ 0.80 Total Private 626.3 $ 2,470.4 $ 1,151.4 $ 547.1 $ 1,667.4 $ 781.3 $ Total Public and Private 867.2 $ 3,593.2 $ 1,612.0 $ 708.7 $ 2,196.8 $ 1,014.9 $ (1) Calculated using: (2008 defaulted population) + (2009 defaults) - (2009 Emergences)- (2009 Distressed Restructurings) (2) Based on 15.3% of the high yield bond market ($1.183 trillion) as of 12/31/09 (3) Based on a private/public ratio of 2.5

Sources: Estimated by Professor Edward Altman, NYU Stern School of Business from NYU Salomon Center's Defaulted Bond and Bank Loan Databases

slide-21
SLIDE 21

41 41 41

Size Of The US Defaulted And Distressed Debt Market ($ Billions)

1990 – 2009

Source: Author’s Compilations

$- $500 $1,000 $1,500 $2,000 $2,500 $3,000 $3,500 $4,000 1 9 9 1 9 9 2 1 9 9 3 1 9 9 5 1 9 9 8 1 9 9 9 2 2 1 2 2 2 3 2 4 2 5 2 6 2 7 2 8 2 9

Face Value Market Value

42 42 42

Returns and Correlations of the Defaulted Debt Markets

slide-22
SLIDE 22

43

Hedge Fund Distressed Debt Index Returns

2003 – 2009

Sources: Bloomberg & NYU Salomon Center

55.99% N/A 28.54% 42.97% 20.95% 2009

  • 47.52%
  • 21.05%
  • 25.21%
  • 29.28%
  • 20.48%

2008

  • 3.30%

7.37% 5.07% 8.31% 8.28% 2007 23.38% 15.33% 15.95% 15.78% 15.58% 2006 1.73% 9.34% 8.25% 9.71% 11.75% 2005 15.14% 18.19% 18.89% 18.98% 15.60% 2004 49.30% 27.42% 29.58% 26.79% 25.12% 2003 Altman- Combined Van Hedge HFR Hennessee Credit Suisse/ Tremont Calendar Year

44 44 44 44

Defaulted Debt Indexes: Market-to-Face Value Ratios

(1987 – 2010 (Jan. 29 th))

Source: Altman-NYU Salomon Center Defaulted Debt Indexes

0.00 0.10 0.20 0.30 0.40 0.50 0.60 0.70 0.80 0.90 1.00 1987 1988 1989 1990 1991 1992 1993 1994 1995 1996 1997 1998 1999 2000 2001 2002 2003 2004 2005 2006 2007 2008 2009 2010 (1/29)

Market-to-Face Ratio

Loans Bonds Bonds Average Loans Average

Loans Median Market-to-Face value is 0.62 and Average Market-to-Face value is 0.65 Bonds Median Market-to-Face value is 0.45 and Average Market-to-Face value is 0.40

slide-23
SLIDE 23

45 45 45 45

Year Altman-NYU Salomon Center Defaulted Bond Index S&P 500 Stock Index Citigroup High Yield Bond Index 1987 37.85% 5.26% 6.07% 1988 26.49% 16.61% 13.47% 1989

  • 22.78%

31.68% 2.75% 1990

  • 17.08%
  • 3.12%
  • 7.04%

1991 43.11% 30.48% 39.93% 1992 15.39% 7.62% 17.86% 1993 27.91% 10.08% 17.36% 1994 6.66% 1.32%

  • 1.25%

1995 11.26% 37.56% 19.71% 1996 10.21% 22.96% 11.29% 1997

  • 1.58%

34.36% 13.18% 1998

  • 26.91%

28.58% 3.60% 1999 11.34% 20.98% 1.74% 2000

  • 33.09%
  • 9.11%
  • 5.68%

2001 17.47%

  • 11.87%

5.44% 2002

  • 5.98%
  • 22.08%
  • 1.53%

2003 84.87% 28.70% 30.62% 2004 18.93% 10.88% 10.79% 2005

  • 1.78%

4.92% 2.08% 2006 35.62% 15.80% 11.85% 2007

  • 11.53%

5.50% 1.83% 2008

  • 55.09%
  • 37.00%
  • 25.91%

2009 96.42% 26.46% 55.19% 2010 (1/29) 9.09%

  • 3.60%

1.12% 1987 - 2009 Arithmetic 11.53% 10.54% 9.35% Average (Annual) Rate Standard Deviation 33.99% 18.83% 16.26% 1987 - 2009 Compounded 6.41% 9.39% 8.56% Average (Annual) Rate 1987 - 2009 Arithmetic 0.64% 0.86% 0.73% Average (Monthly) Rate Standard Deviation 4.86% 4.53% 2.59% 1987 - 2009 Compounded 0.52% 0.75% 0.69% Average (Monthly) Rate (1987 - 2010 (Jan. 29th)) ALTMAN-NYU SALOMON CENTER DEFAULTED BOND INDEX COMPARISON OF RETURNS

46 46 46 46

Year Altman-NYU Salomon Center Defaulted Bank Loan Index S&P 500 Stock Index Citigroup High Yield Bond Index 1996 19.56% 22.96% 11.29% 1997 1.75% 34.36% 13.18% 1998

  • 10.22%

28.58% 3.60% 1999 0.65% 20.98% 1.74% 2000

  • 6.59%
  • 9.11%
  • 5.68%

2001 13.94%

  • 11.87%

5.44% 2002 3.03%

  • 22.08%
  • 1.53%

2003 27.48% 28.70% 30.62% 2004 11.70% 10.88% 10.79% 2005 7.19% 4.92% 2.08% 2006 4.35% 15.80% 11.85% 2007 2.27% 5.50% 1.83% 2008

  • 43.11%
  • 37.00%
  • 25.91%

2009 32.80% 26.46% 55.19% 2010 (1/29) 2.83%

  • 3.60%

1.12% 1996 - 2009 Arithmetic Average (Annual) Rate 4.63% 8.51% 8.18% Standard Deviation 18.27% 21.44% 18.32% 1996 - 2009 Compounded 2.86% 6.25% 6.81% Average (Annual) Rate 1996 - 2009 Arithmetic Average (Monthly) Rate 0.31% 0.62% 0.60% Standard Deviation 3.34% 4.67% 2.97% 1996 - 2009 Compounded 0.25% 0.51% 0.55% Average (Monthly) Rate (1996 - 2010 (Jan. 29th)) ALTMAN-NYU SALOMON CENTER DEFAULTED BANK LOAN INDEX COMPARISON OF RETURNS

slide-24
SLIDE 24

47 47 47 47

Year Altman-NYU Salomon Center Combined Index S&P 500 Stock Index Citigroup High Yield Bond Index 1996 15.62% 22.96% 11.29% 1997 0.42% 34.36% 13.18% 1998

  • 17.55%

28.58% 3.60% 1999 4.45% 20.98% 1.74% 2000

  • 15.84%
  • 9.11%
  • 5.68%

2001 15.56%

  • 11.87%

5.44% 2002

  • 0.53%
  • 22.08%
  • 1.53%

2003 49.30% 28.70% 30.62% 2004 15.14% 10.88% 10.79% 2005 1.73% 4.92% 2.08% 2006 23.38% 15.80% 11.85% 2007

  • 3.30%

5.58% 1.83% 2008

  • 47.52%
  • 37.00%
  • 25.91%

2009 55.99% 26.46% 55.19% 2010 (1/29) 4.96%

  • 3.60%

1.12% 1996 - 2009 Arithmetic Average (Annual) Rate 6.79% 7.70% 7.71% Standard Deviation 25.37% 20.90% 17.75% 1996 - 2009 Compounded 3.65% 6.26% 6.81% Average (Annual) Rate 1996 - 2009 Arithmetic Average (Monthly) Rate 0.55% 0.48% 0.50% Standard Deviation 3.62% 4.80% 3.06% 1996 - 2009 Compounded 0.49% 0.37% 0.45% Average (Monthly) Rate (1996 - 2010 (Jan. 29th)) COMBINED ALTMAN-NYU SALOMON CENTER DEFAULTED PUBLIC BOND AND BANK LOAN INDEX COMPARISON OF RETURNS

48 48 48 48

CORRELATION OF ALTMAN NYU-SALOMON CENTER INDEXES OF DEFAULTED BONDS WITH OTHER SECURITIES INDEXES 1987 – 2009

Altman Bond Index S&P 500 Citi HY Index 10yr T-Bond Altman Bond Index 100.00% 40.38% 67.24%

  • 27.31%

S&P 500 100.00% 56.29% 0.33% Citi HY Index 100.00%

  • 2.68%

10-yr T-Bond 100.00%

Correlation of Altman Bond Index Monthly Returns

slide-25
SLIDE 25

49

CORRELATION OF ALTMAN NYU-SALOMON CENTER INDEXES OF DEFAULTED LOANS WITH OTHER SECURITIES INDEXES 1996 – 2009

Altman Bond Index Altman Loan Index Altman Combined Index S&P 500 Citi HY Index 10yr T- Bond Altman Bond Index 100.00% 66.29% 92.09% 42.41% 69.77%

  • 34.68%

Altman Loan Index 100.00% 89.16% 33.38% 58.50%

  • 26.13%

Altman Combined Index 100.00% 40.97% 69.21%

  • 33.95%

S&P 500 100.00% 60.26%

  • 14.63%

Citi HY Index 100.00%

  • 14.78%

10-yr T-Bond 100.00% Correlation of Altman Indices Monthly Returns 50 50 50

U.S. Distressed Debt Managers

Abrams Capital Black River Asset Mgmt Cerberus Partners ADM Maculus Blackrock Citadel Investments AEG Blackstone Group Cohanzick Mgmt Anchorage Advisors Blue Mountain Cap Mgmt Columbus Hill Cap. Angelo, Gordon & Co. Blue Wolf Capital Commonwealth Advisors Apex Fndmntl Partners Bluebay Asset Mgmt Concordia Advisors Apollo Managememt Bluecrest Cap. Mgmt Contrarian Cap. Mgmt Appaloosa Mgmt Bond Street Capital Corsair Capital Archview Investment Boone Capital Mgmt Cypress Mgmt Ares Corp. Opp. Fund Brencourt Advisors Cyrus Capital Partners Ashmore Asian Recov. Brigade Capital D.E. Shaw Atalaya Cap. Mgmt The Broe Companies Davidson / Kempner Aurelius Capital Mgmt

Brookfield Asset Mgmt

DDJ Capital Mgmt Avenue Capital Group Canyon Capital Deephaven Cap. Mgmt Basso Asset Mgmt Candlewood Partners Delaware Street Capital Baupost Group Cardinal Capital Deltec Recovery Fund Bay Harbour Mgmt Carl Marks DKPR Wolf Point Mgmt Bayside Capital Carlyle Strategic Drake Mgmt Beltway Capital Cargill Value Invstmt Dreman Value Mgmt Bennett Mgmt Co. CarVal Investors Drucker Capital Black Diamond Caspian Capital Dune Capital Mgmt Blackport Capital Fund, Centerbridge Capital

slide-26
SLIDE 26

51 51 51

U.S. Distressed Debt Managers

Durham Asset Mgmt Gradient Partners Ivory Invest. Management Eagle Rock Capital Gramercy Capital Jana Partners Elliott Advisors Greenlight Capital JLL Partners Endurance Capital Greywolf Capital JMB Capital EOS Partners Gruss Asset Mgmt K Capital Partners Epic Asset Mgmt GSC Group Katonah Scott's Cove Cap. Mgmt. Everest Capital Ltd GSO Capital Prtnrs KD Distressed Capital Fairfield Greenwich Guggenheim Inv. Mgmt Kilimanjaro Advisors Farallon Partners H.I.G. King Street Advisors Fintech Advisory Hain Capital Knighthead Capital Fir Tree Partners Halbis Cap. Mgmt (US) KPS Spec. Siittns Fd Forest Invstmnt Mgmt Halcyon/Slika Mgmt. Lampe Conway Franklin Mutual Rec. Harbert Fund Advisors Latigo Partners Fridson Investment Advisors Harbinger Capital Laurel Ridge Ast Mgmt. Fulcrum Capital Mgmt Harvest Capital Leucadia Nat'l Corp. GE Finance Helios Advisors Levco Debt Opps Glenview Capital Mgmt HIG Brightpoint Cap. Litespeed Partners GLG Partners, NA Highbridge Cap. Mgmt Littlejohn & Co. Global Credit Advisors Highland Capital Loeb Partners Golden Capital Highland Rest. Cap. Lonestar Partners GoldenTree Asset Mgmt Huizenga Capital Mgmt LongAcre Cap. Partners Goldman Spec Situations Icahn Capital Corp. Longroad Asset Mgmt Gracie Capital Insight Equity Marathon Capital 52 52 52

U.S. Distressed Debt Managers

Marathon Capital Paige Capital Seneca Cap. Inv. Ptnshp Mariner Invest. Group Pardus Capital Signature Cap. Partners Mason Capital Management Patriarch Silverpoint Capital MatlinPatterson Global Paulson & Co. Solus Alternative Management Mellon HBV Cap. Mgmt Pegasus Investors Soros NY MHR Perella Weinberg Ptnrs Cap. Spring Street Millennium Perry Partners Stanfield Capital Mgmt MJ Whitman Mgmt Co. Phoenix Investment Adviser Stairway Capital Advisors Monarch Alternative Cap. Pine Creek Standard General Management Monomoy Capital Pinewood Cap. Partners Stark Investments Mount Kellett Cap. Mgmt Plainfield Asset Mgmt Stone Harbor Inv. Ptnrs MSD Capital PMI Stonehill Capital New Generation Advisers Principal Global Investors Stone Lion Capital Normandy Hill Capital Questor Management Stony Lane Partners Oakhill Radius Partners Strategic Value Partners Oaktree Capital Ramius Summit Och Ziff Capital Management Redwood Capital Sunrise Capital Partners Octavian Advisors Resolution Partners TA Mckay & Co. Onex Credit Partners Restoration Capital Mgmt Taconic Capital Partners Orehill Partners Resurgence Corp. Fund Tennenbaum Capital Owl Creek Asset Management Salisbury Third Avenue Value Fund Pacholder Assoc., Inc. Sandell Asset Mgmt Third Point Pacific Altern. Ast Mgmt. Scoggin Capital Tiburon Capital Management

slide-27
SLIDE 27

53 53 53

U.S. Distressed Debt Managers

TPG Credit Management William E. Simon & Sons Treadstone Group Woodside Management Tricadia Capital York Capital Triage Capital Z Capital Partners Trilogy Capital Trust Co. of the West Tuckerbrook Tudor Investment Corp. Turnberry Capital Tyndall Partners Van Kampe Varde Partners, Inc. Venor Capital Mgmt Versa Capital Mgmt Viking Global W.L. Ross & Co. Washington Corner Cap. Watershed Asset Management Wayzata Invest. Partners Wellspring Cap. Partners Wexford Capital Whippoorwill Assoc., Inc. 54 54 54

U.S. Distressed Funds w ith European Offices European Distressed Debt Managers (Home Grow n)

Aladdin Capital Management Och Ziff Capital Mgmt. Alchemy Partners Perusa Apollo Management Peter Schoenfeld Asset Mgmt. Argo Capital Providente Avenue Capital Group Silverpoint Capital Arrowgrass Capital Partners RAB Capital Camulos Capital Strategic Value Partners Bluebay Asset Management Rutland Fund Cargill Investors TPG Credit Mgmt. Butler Capital Management Sisu Capital Cerberus Partners Värde Partners Carousel Sothic Capital Management Citadel Investments Cyrus Capital Trafalgar Asset Managers Davidson Kempner Development & Partenariat Verdoso Special Opportunity Fund D.E. Shaw Endless Vermeer Capital Partners Elliott Advisors EQT Opportunities EOS Partners Equinox Fortress Capital Corp Fin'active HBK Investments Fortelus Capital management Highbridge Capital Management Green Recovery Kelso Place Asset Management H2 Equity Partners Lonestar Partners HIG Europe Capital Partners Marathon Capital Ilex Matlin Patterson Global Advisors Marco Polo Millennium Capital Nordwind Capital Oaktree Capital Orlando Management GmbH

slide-28
SLIDE 28

55 55 55

Distressed Active/Control Investors

American Securities GSC Group Paulson & Co. Angelo, Gordon & Co. Harbinger Capital Partners Perry Capital Apollo Management H.I.G. Capital Plainfield Asset Mgt Appaloosa Management Highland Rest. Capital Partners Platinum Equity Capital Partners Audax Credit Opportunities Industria Partners Prophet Equity Aurelius Capital Management Insight Equity I Ramius Capital Group

Aurora Resurgence Mgt Partners

Levine Liechtman Relativity Fund Avenue Capital Partners Littlejohn & Co. Remedial Capital Bay Harbour Management Lone Star Partners Resurgence Asset Management Black Diamond Longroad Asset Management Sandell Asset Management Corp. BlackEagle Partners KPS Special Situations Fund Saybrook Capital Brookfield Asset Mgmt Marathon Capital Silver Point Capital Carlyle Strategic Partners Marlin Equity Partners Stark Investments Catalyst Partners MatlinPatterson Global Advisors Stony Lane Partners Centerbridge Capital Partners Mellon HBV Strategic Value Partners Cerberus Partners MHR Institutional Partners Sun Capital Partners Citadel Limited Partnership Millroad Partners Sunrise Capital DDJ Capital Management Monomoy Capital Partners TCW Crescent Mezzanine D.E. Shaw Newport Global Advisors TPG Credit Management Elliott Associates Oakhill Tuckerbrook Ewing Management Oaktree Capital Tudor Investment Corp et al Farallon Capital Panagaen Capital Management Vector Capital Gores Group

  • P. Schoenfeld Asset Management

Versa Capital Management

56 56 56

Distressed Active/Control Investors

Water Tower Capital Wayzata Investment Partners W.L. Ross & Co Whippoorwill Associates Wingate Partners York Capital Z Capital Partners

slide-29
SLIDE 29

57 57 57

Investment Styles and Target Returns in Distressed Debt Investing