SLIDE 1
Supplementary Figure 1
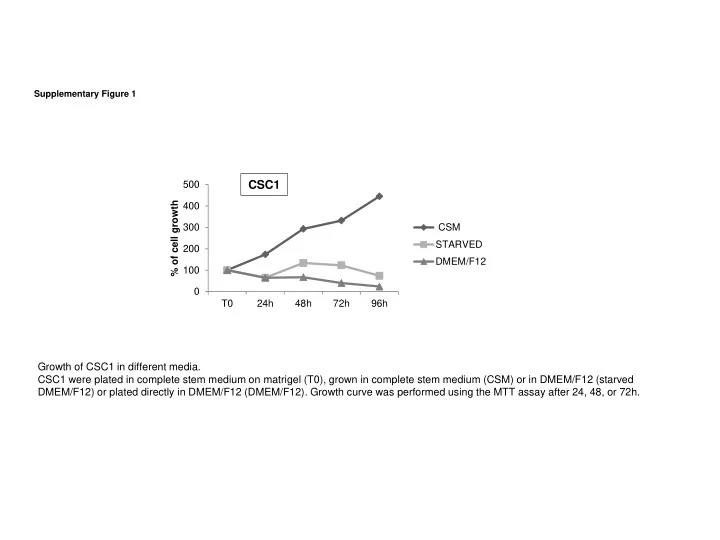
Growth of CSC1 in different media. CSC1 were plated in complete stem medium on matrigel (T0), grown in complete stem medium (CSM) or in DMEM/F12 (starved DMEM/F12) or plated directly in DMEM/F12 (DMEM/F12). Growth curve was performed using the MTT assay after 24, 48, or 72h.
CSC1
100 200 300 400 500 T0 24h 48h 72h 96h % of cell growth CSM STARVED DMEM/F12
SLIDE 2
DMEM/F12
COMPLETE STEM MEDIUM
CSC1 CSC2 CSC3
Supplementary Figure 2 Effects of different media on sphere formation. Morphological appearance of CSC1, CSC2, CSC3 grown as floating spheres in complete stem medium and as rare adherent non proliferating cells in DMEM/F12 medium.
SLIDE 3 Supplementary Figure 3 50 100 150 200 250 300 350 % of cell growth CSC1 CSC2 CSC3
*** * *** ***
ns
***
ns
*** *** ** *** *** ***
Effects of individual conditioned medium derived from UC-MSCs on CSC1, CSC2, CSC3. CSC growth was analyzed, after 72h of culture in the absence (DMEM/F12) or presence of UC-MSC-derived conditioned medium (CM) by MTT assay. Statistical analysis was performed with One-way ANOVA p<0.0001; with post-hoc analysis by the Dunnett’s test. * p<0.05; ** p< 0.01; *** p< 0.001; ns: non statistically significant.
SLIDE 4
50 100 150 200 250 300 350 400 450 500 TO 24h 48h 72h 144h % of cell growth MESENPRO DMEM/F12 MC CSC1 MC CSC2 MC CSC3 UC-MSC Supplementary Figure 4 Effects of individual conditioned media derived from CSC1, CSC2, CSC3 on UC-MSC growth. UC-MSC growth was analyzed by MTT assay in presence of CSCs derived conditioned media (MC) collected from CSC1, CSC2, CSC3 grown in DMEM/F12 for 72h, or DMEM/F12 referred as control. As normal proliferation control, UC-MSC growth was evaluated also in MesenPro medium
SLIDE 5
A D C B Supplementary Figure 5. qPCR evaluation of GRO alpha, beta and gamma, and IL-8 expression in UC-MSC (A), CSC1 (B), CSC2 (C), and CSC3 (D). Comparison was performed between gene expression in cells grown in complete stem cell medium and serum free medium DMEM/F12 (ST)