SLIDE 1
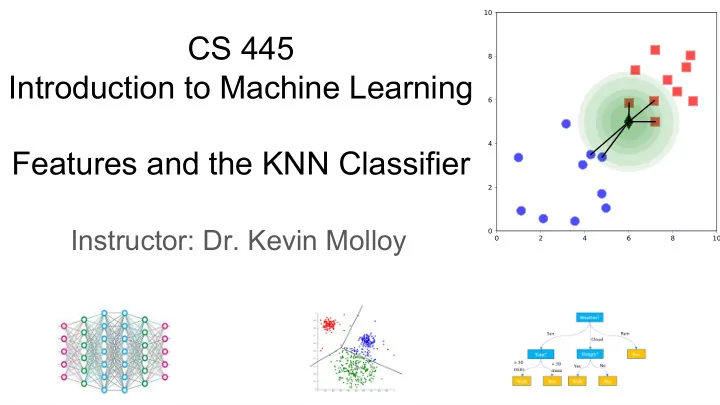
CS 445 Introduction to Machine Learning Features and the KNN Classifier
Instructor: Dr. Kevin Molloy
SLIDE 2
Features
If it walks like a duck, and quacks like a duck, it probably is a duck. Features describe the observation:
SLIDE 3
Decision Tree Architecture
Idea: Identify the feature and the value of the feature (split point) that divides the data into 2 groups that minimizes the weighted "impurity" of each group. Repeat this process on each leaf until happy. Observation: The model splits the data one feature at a time.
SLIDE 4
Define a method to measure the distance between two observations. This distance incorporates a set of the features into a single number (scalar). Idea: Small distances between observations imply similar class labels.
Distance (dissimilarity) between observations
Euclidean Distance and Nearest Point Classifier 1. Compute distance from new point p (the black diamond) and the training set.
point Dist to p
1 2.45 2 1.30 3 0.99 … … n 8.23
SLIDE 5
Define a method to measure the distance between two observations. This distance incorporates all the features at once. Idea: Small distances between observations imply similar class labels.
Distance (dissimilarity) between observations
Euclidean Distance and Nearest Point Classifier 1. Compute distance from new point p (the black diamond) and the training set. 2. Identify the nearest point and assign its label to point p
point Dist to p
1 2.45 2 1.30 3 0.99 … … n 8.23
SLIDE 6
Euclidean Distance and Nearest Point Classifier
Voronoi Diagram
(https://en.wikipedia.org/wiki/Voronoi_diagram)
Create regions such that for any point p in the same region, their closest data point (the dots) are the same.
SLIDE 7
Euclidean Distance and Nearest Point Classifier
Voronoi Diagram
(https://en.wikipedia.org/wiki/Voronoi_diagram)
Create regions such that for any point p in the same region, their closest data point (the dots) are the same.
Outlier – an object different than most other objects of the same type
SLIDE 8 Euclidean Distance and K-Nearest Point Classifier
Idea: Increase the number of neighbors (k) and take a majority vote. Algorithm
k = number of nearest neighbors D = training examples and labels (x, y) z = point (vector of points) to classify Compute dist(xi, z) (distance between z and every training data point xi) Dz = set of k closest examples to z (Dz ⊆ D) zpredict = argmin
!
∑(#!,%!)∈(" 𝐽(𝑤 == 𝑧))
SLIDE 9
Decision Boundaries:
Boundaries are perpendicular (orthogonal) to the feature being split. What do the KNN decision boundaries look like?
SLIDE 10
Will I go Outside to play Today?
Let's try and build a model and predict.
Feature Values Weather Sunny, Rainy, Overcast Temperature Hot, Mild, Cold
The label/class will be to predict if the child will play outside (Yes/No). Issues?
SLIDE 11
Computing Distances
How to compute a distance between Sunny, Rainy, and Overcast?
SLIDE 12
Computing Distances
How to compute a distance between Sunny, Rainy, and Overcast? Is Dist(Sunny, Cloudy) == Dist(Sunny, Rainy) ?
SLIDE 13
Computing Distances
How to compute a distance between Sunny, Rainy, and Overcast?
Is Dist(Sunny, Cloudy) == Dist(Sunny, Rainy) ?
Difference between ordinal and nominal datatypes (see IDD section 2.1.2)
SLIDE 14 Smallest Distance means Most Similar?
Dataset
Age Salary 23 56K 35 75K 55 76K
Who is the most similar person to this in the dataset (right)? Age = 39 Salary = 75,750
SLIDE 15 Smallest Distance means Most Similar?
Dataset
Age Salary 23 56K 35 75K 55 76K
Who is the most similar person to this in the dataset (right)? Age = 39 Salary = 75,750
SLIDE 16 Smallest Distance means Most Similar?
Dataset
Age Salary 23 56K 35 75K 55 76K
Who is the most similar person to this in the dataset (right)? p = (Age = 39 , Salary = 75,750)
However, the Euclidian distances say otherwise.
Age Salary Distance to point p 23 56K 39 − 23 ! + 75750 − 56000 ! ≈ 19,750 35 75K 39 − 35 ! + 75750 − 75000 ! ≈ 750 55 76K 39 − 55 ! + 75750 − 76000 ! ≈ 251
SLIDE 17 Normalization
Dataset
Age Salary 23 56K 35 75K 55 76K
Idea: Make the range of all features the same. Start with age. Min value: 23, max value: 55
Age Salary Dist (orig) Age normalized Salary Normalized Dist (with normalized values) 23 56K 19,750 (23 – 23)/(55-23) = 0 (56k –56k)/(76k – 56k) = 0 35 75K 750 (35-23)(55-23) = 0.375 (75k – 56k)/(76k-56k) = 0.95 55 76K 251 (55-23)/(55-23) = 1.0 (76k-56k)/(76k-56k) = 1
𝑦),*
+ = #!,$ ,-./(0!)
p = (Age = 39 , Salary = 75,750)
SLIDE 18 Normalization
Dataset
Age Salary 23 56K 35 75K 55 76K
Idea: Make the range of all features the same. Start with age. Min value: 23, max value: 55
Age Salary Dist (orig) Age normalized Salary Normalized Dist (with normalized values) 23 56K 19,750 (23 – 23)/(55-23) = 0 (56k –56k)/(76k – 56k) = 0 1.1 35 75K 750 (35-23)(55-23) = 0.375 (75k – 56k)/(76k-56k) = 0.95 0.13 55 76K 251 (55-23)/(55-23) = 1.0 (76k-56k)/(76k-56k) = 1 0.50
𝑦),*
+ = #!,$ ,-./(0!)
p = (Age = 39 , Salary = 75,750)