
SLIDE 1
Crops and Climate
Len Coop, OSU
Integrated Plant Protection Center & Botany Plant Pathology
Feb 28, 2015 Small Farms Conference, Corvallis, OR (minor updates Mar 2, 2015)
Crops and Climate Len Coop, OSU Integrated Plant Protection Center - - PowerPoint PPT Presentation
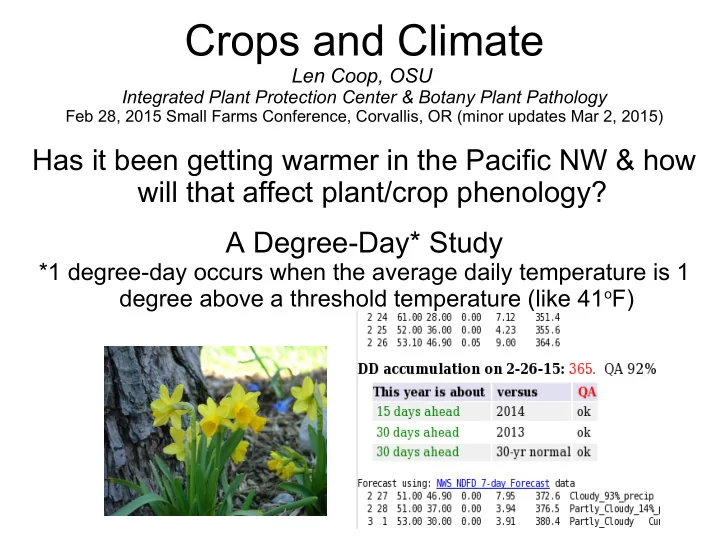
Crops and Climate Len Coop, OSU Integrated Plant Protection Center & Botany Plant Pathology Feb 28, 2015 Small Farms Conference, Corvallis, OR (minor updates Mar 2, 2015) Has it been getting warmer in the Pacific NW & how will that
Len Coop, OSU
Integrated Plant Protection Center & Botany Plant Pathology
Feb 28, 2015 Small Farms Conference, Corvallis, OR (minor updates Mar 2, 2015)
Daffodils, That come before the swallow dares, and take The winds of March with beauty. –William Shakespeare, The Winter's Tale
Feb 28, 1992 (closest year in 100 years [372 DD] – followed eruption of Mt. Pinatuba) Feb 28, 2015 at 385 DD!
April 27, 1955 (8 wks later than this year) Feb 27, 2015
58% chance
temperatures for Jan and Feb 2015 Feb 2015 forecast Jan 2015 forecast
Precip Temps March 2015 April 2015 May 2015
Feb 2015 forecast Feb 2015 forecast
Feb PRISM Normals
Localized forecast For pest & crop models at uspest.org