Crash Safety of Batteries for Prof. Wayne Chen, PI, wchen@purdue.edu - - PowerPoint PPT Presentation

crash safety of batteries for
SMART_READER_LITE
LIVE PREVIEW

Crash Safety of Batteries for Prof. Wayne Chen, PI, wchen@purdue.edu - - PowerPoint PPT Presentation

TEAM: Purdue University Research Group Crash Safety of Batteries for Prof. Wayne Chen, PI, wchen@purdue.edu Passenger Vehicles Prof. Thomas Siegmund, Co-PI, siegmund@purdue.edu Current Status Technology Overview Multifunctional EV


slide-1
SLIDE 1

Technology Overview Current Status

Crash Safety of Batteries for Passenger Vehicles

TEAM: Purdue University Research Group

  • Prof. Wayne Chen, PI, wchen@purdue.edu
  • Prof. Thomas Siegmund, Co-PI, siegmund@purdue.edu

Project Statistics

Award Amount $0.5 M Award Timeline

  • Dec. 2013 – Nov. 2014

Next Stage Target 375 Wh impact resistant battery system, $0.3 M

  • Jan. 2015 – Jun. 2015

Collaborations Sought ARPA-E plus up (Funding) PSU and ORNL (Technical)

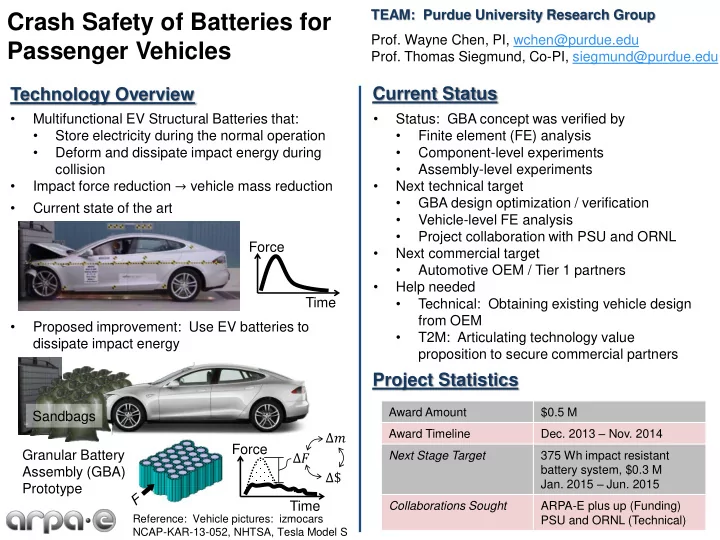
  • Multifunctional EV Structural Batteries that:
  • Store electricity during the normal operation
  • Deform and dissipate impact energy during

collision

  • Impact force reduction → vehicle mass reduction
  • Status: GBA concept was verified by
  • Finite element (FE) analysis
  • Component-level experiments
  • Assembly-level experiments
  • Next technical target
  • GBA design optimization / verification
  • Vehicle-level FE analysis
  • Project collaboration with PSU and ORNL
  • Next commercial target
  • Automotive OEM / Tier 1 partners
  • Help needed
  • Technical: Obtaining existing vehicle design

from OEM

  • T2M: Articulating technology value

proposition to secure commercial partners

Reference: Vehicle pictures: izmocars NCAP-KAR-13-052, NHTSA, Tesla Model S

  • Current state of the art
  • Proposed improvement: Use EV batteries to

dissipate impact energy Time Force Sandbags Granular Battery Assembly (GBA) Prototype Time Force ∆𝐺 ∆𝑛 ∆$

slide-2
SLIDE 2

10 20 30 40 50 60 100 200 300 400 500 Displacement (mm) Force (kN) Al 6061,  = 0.15 Al 6061,  = 0.35 Al 6061,  = 0.55 Al 6061,  = 0.75 SS 304,  = 0.15 SS 304,  = 0.35 SS 304,  = 0.55 SS 304,  = 0.75

20 40 60 80 100 120 10 20 30 40 50 60 Force (kN) Displacement (mm) 0:25 4:21 8:17 13:12 25:0

Finite Element Analysis

2

Simplified Model

[25:0] [13:12] [4:21] [8:17] [0:25] Ratio: [Battery:Tube]

Reference: Battery cell constitutive model: Sahraei, Campbell, & Wierzbicki (2012) Simplified Full

Full Model

Effects of sacrificing cell materials and coefficient of friction on GBA 𝑢𝐵𝑚 6061 = 0.51 mm; 𝑢𝑇𝑇 304 = 0.13 mm

Component Model 18650 LiFePO4 Cell by A123

2 4 6 8 10 10 20 30 40 50 Displacement (mm) Force (kN) Exp., SOC = 1:8% Exp., SOC = 10:0% Finite Element Model

Fracture

slide-3
SLIDE 3

Impact Energy Dissipation Demonstration

3

Upper Fixture Specimen Lower Fixture Loading Direction Load Cell Connection Loading Direction Load Cell Wall Specimen Winch Springs Specimen Drop Mass Tup Loading Direction Bottom Support Load Cell

MTS Machine Suitcase Portable Impactor Drop Tower Impactor

Loading Type Component Level Assembly Level Research Demon- stration Showcase Demon- stration Sacrificing Tubes Battery Cells GBA MTS Quasi-static Yes Yes Yes Yes

  • Drop Tower

Dynamic Yes Yes Yes Yes

  • Suitcase

Dynamic

  • Yes

(Reduced capacity)

  • Yes
slide-4
SLIDE 4

Component-level Analysis

4

Quasi-static Study Dynamic Study

𝜁 = 10−1/𝑡 (𝑤 = 1.82 𝑛𝑛/𝑡) 𝜁 = 101/𝑡 (𝑤 = 182 𝑛𝑛/𝑡) t = 1.14 𝑛𝑛 t = 0.51 𝑛𝑛 t = 1.24 𝑛𝑛 In addition to the above study, the following experiments were also performed: 1) Sacrificing tubes under quasi-static line loading, 2) sacrificing tubes under dynamic line loading, 3) battery cells under dynamic line loading, and 4) battery cells under point loading. Mass: 7.3 𝑙𝑕; Velocity: 2.0 𝑛/𝑡; Energy 14.6 𝐾 Glass Al Al

2 4 6 8 10 5 10 15 Displacement (mm) Force (kN) Al, t = 0.51 mm Al, t = 0.89 mm Al, t = 1.24 mm Al, t = 1.47 mm Al, t = 1.65 mm Glass, t = 1.14 mm

See top right

0.5 1.5 Displacement (mm) Force (kN) 2 4 6 8 10 10 20 30 40 50 60 70 Displacement (mm) Force (kN)

_

0= 10! 3 =s

_

0= 10! 2 =s

_

0= 10! 1 =s

_

0= 101 =s

State of charge (SOC) = 10%

slide-5
SLIDE 5

Assembly-level Analysis

5

Preliminary Study: Sacrificing Foams GBA vs. Base

Preliminary setup with sacrificing foams enabled multiple hits without replacements. Velocity 2.5 𝑛/𝑡 Low Velocity 3.0 𝑛/𝑡 High Mass 11.7 𝑙𝑕 Low Low- Low (36.5 𝐾) Low- High (52.6 𝐾) Mass 16.7 𝑙𝑕 High High- Low (52.2 𝐾) High- High (75.1 𝐾) Mass: 27.5 𝑙𝑕; Velocity: 5.0 𝑛/𝑡; Energy: 343.7 𝐾

5 10 15 20 25 30 35 10 20 30 40 Displacement (mm) Force (kN) Base GBA

32.8% reduction GBA Base Performance of this particular GBA system was worse than expected. To improve the performance, friction properties and strength of sacrificing cells will need to be optimized.

5 10 15 20 25 30 35 5 10 Displacement (mm) Force (kN) Low-Low Low-High High-Low High-High

slide-6
SLIDE 6

Effects of Peak Force (𝒍𝑶) Reduction on Vehicle Weight (𝒍𝒉) and Price ($)

6

Impact force reduction → Vehicle weight reduction → Vehicle price reduction Impact Force (𝑙𝑂) Vehicle Weight (𝑙𝑕) Vehicle Price ($) 750 1,846 36,696 504 1,173 13,645 ∆ Impact Force = 246 kN (32.8% reduction) ∆ Vehicle Weight = 673 kg (36.4% reduction) ∆ Vehicle Price = $23,051 (62.8% reduction)

  • Maximum Impact Force Analysis (Left) and Purchase Price Analysis (Right) with respect to vehicle weight
  • Example: Assuming linear scale up from the prototype to full vehicle

200 400 600 800 1,000 1,000 1,500 2,000 Max Impact Force (kN) Vehicle Weight (kg) 5,000 15,000 25,000 35,000 45,000 1,000 1,500 2,000 Vehicle Price ($) Vehicle Weight (kg)