Course adjustment EnergyPlus (E+) - SIMERGY - - PowerPoint PPT Presentation

course adjustment
SMART_READER_LITE
LIVE PREVIEW

Course adjustment EnergyPlus (E+) - SIMERGY - - PowerPoint PPT Presentation

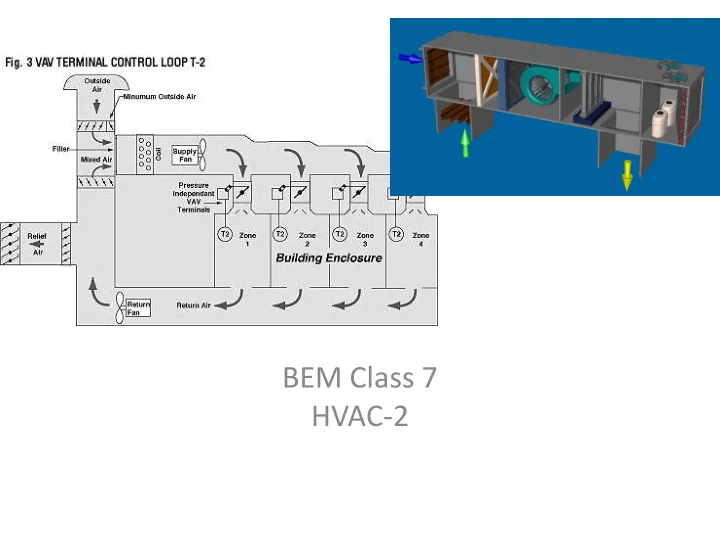
BEM Class 7 HVAC-2 Course adjustment EnergyPlus (E+) - SIMERGY http://simulationresearch.lbl.gov/projects/gui http://simergy-beta.lbl.gov/ Download please for use in class demo sessions (April classes) Review from class 6


slide-1
SLIDE 1

BEM Class 7 HVAC-2

slide-2
SLIDE 2

Course adjustment

  • EnergyPlus (E+) - SIMERGY

– http://simulationresearch.lbl.gov/projects/gui – http://simergy-beta.lbl.gov/ – Download please for use in class demo sessions (April classes)

slide-3
SLIDE 3

Review from class 6

  • Discussion: Principles for Zoning

Exposures Usage types Schedule Tenancy & Metering On shared HVAC equipment

slide-4
SLIDE 4

Review from class 6

  • EQuest tutorial: what do you need to know to

set up HVAC system in EQuest ?

  • How do you obtain this data?
  • How do you know if it’s right?
slide-5
SLIDE 5

Review from class 6 HVAC systems and components

Packaged assemblies – air-handling units, rooftop units

slide-6
SLIDE 6

HVAC Equations Solving from Load to Flows

Air QBTUH = CFM x dT x .018 x 60 (.018 x 60 = 1.08) CFM = QBTUH / (dT x 1.08) typ dT = 20 dF Water QBTUH = GPM x dT x 8.33 x 60 (8.33 x 60 = 500) GPM = QBTUH / (dT x 500) typ dT = 10 dF

slide-7
SLIDE 7

HVAC Equations Solving from Flows to Power

Fan HP = CFM x dP / (6356 x FE)

dP is total pressure in inches of water column, Typ dP = 3 in w.c. FE (fan efficiency) typical value = .65

Pump (closed loop) HP = GPM x dP / (1715 x PE)

dP is dynamic pressure created by pump in psi (for an open loop pump, dP is “lift” in

feet of head and the conversion constant is 3956; 2.31 ft of head = 1 psi)

PE (Pump Efficiency) typical value = .65

Convert Brake Horsepower to Electrical Power

HP x .746 = KW

slide-8
SLIDE 8

HVAC Component Characterization Pump & Fan Curves

  • Component

performance model based on mfr (test) data

  • Plots output (flow) vs

pressure

  • Dampers and valves

also have curves – flow vs position

slide-9
SLIDE 9

HVAC Component Characterization

Part Load Factors – Boilers & Chillers

  • Efficiency vs Load
  • Boilers & Chillers lose

efficiency at part-loads (with exception of most current generation of hi- efficiency equipment)

  • Most operation is at part-

loads

slide-10
SLIDE 10

HVAC Equipment Variables Constant vs Variable Volume

– In CV systems, part-loads typically met by some form of simultaneous heating & cooling (eg – dual duct, re-heat) – Significant electrical savings in slowing down pumps or fans when possible

  • Dampers for variable air volumes delivered to rooms
  • Variable frequency drive controls on fans
slide-11
SLIDE 11

HVAC Equipment Variables

Outside Air control and Economizer

  • Minimum OA for ventilation when heating or cooling
  • Match OA to occupancy (DCV)
  • Maximize OA when cooler than RA (cooling)
slide-12
SLIDE 12

New Construction vs Existing

  • ASHRAE “Appendix G” (90.1)

– Models for comparison only to other models, not for projection of actual energy use

  • Why?
slide-13
SLIDE 13

Model “Calibration”

  • Matching model results to metered data

– How close a match? – What granularity?

  • How is model calibration done?

– Tune individual parameters, such as….. – But which ones and how much? Multiple solutions….but only one actually matches conditions – Use of building data to inform