County Managers Recommendations on Columbia Pike Transit Stations - - PowerPoint PPT Presentation

county manager s recommendations on columbia pike transit
SMART_READER_LITE
LIVE PREVIEW

County Managers Recommendations on Columbia Pike Transit Stations - - PowerPoint PPT Presentation

County Managers Recommendations on Columbia Pike Transit Stations (formerly Super Stops) May 6, 2014 Overview We heard the community We developed a better design We substantially reduced costs We will take over management


slide-1
SLIDE 1

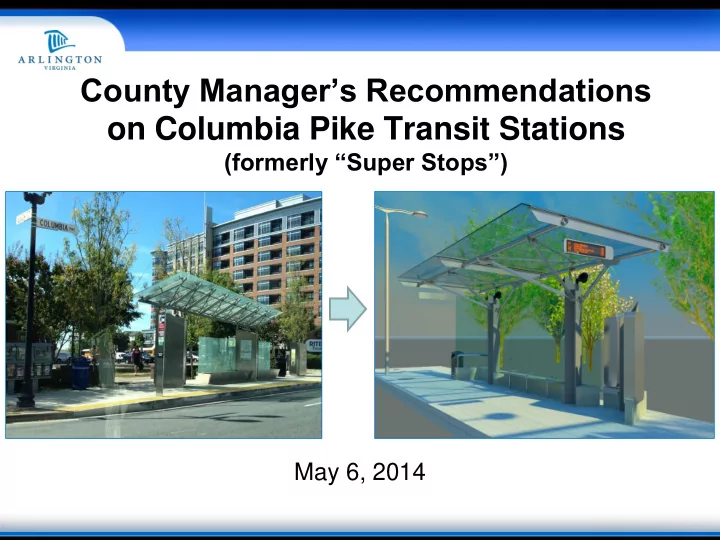
County Manager’s Recommendations

  • n Columbia Pike Transit Stations

(formerly “Super Stops”) May 6, 2014

slide-2
SLIDE 2

 We heard the community  We developed a better design  We substantially reduced costs  We will take over management of the project from WMATA and deliver it effectively and efficiently  We will continue to leverage federal and state funding

2

Overview

slide-3
SLIDE 3

3

Program Funding

2013 CIP = $20.9 million

(24 stations)

2015 CIP = $12.4 million

(23 stations) Federal = 38% $8 million State = 24% $5.1 million Local - TCF= 33% $6.8 million Local - G.O. Bond = 5% $1 million Local - G.O. Bond = 6% $800,000 Federal = 52% $6.4 million State = 14% $1.7 million Local - TCF= 28% $3.5 million

Note: Local - TCF is Arlington County’s Transportation Capital Fund, which is dedicated transportation revenue from the commercial and industrial real estate tax.

slide-4
SLIDE 4
  • Create an improved, walkable “Main Street”
  • Neighborhoods, including a town center, linked by

enhanced transit and wider sidewalks

Transform the corridor from an “aging auto-oriented, suburban, commercial strip”

Vibrant, pedestrian-friendly, “Main Street” destination.

into a

Vision for the Pike

slide-5
SLIDE 5

LAND USE TRANSPORTATION

2000 2002 2004 2006 2008 2014

5

2010 2012

Integrating Land Use and Transportation on the Pike

Chronology

slide-6
SLIDE 6

Transit Ridership on the Pike

6

2,000 4,000 6,000 8,000 10,000 12,000 14,000 16,000 18,000 20,000

FY 2003 FY 2004 FY 2005 FY 2006 FY 2007 FY 2008 FY 2009 FY 2010 FY 2011 FY 2012 FY 2013 FY 2014*

Average Weekday Ridership (Boardings)

* FY 2014 ridership is estimated based on actual for months to date and forecast for year remaining. Pike Ride implemented in FY 2004

slide-7
SLIDE 7

7

Types of Stops / Stations

Cost and ridership information based on survey of projects in the industry. Typical Daily Ridership (Boardings): Up to 40 40 to 100+ 250 to 1000+ 1000+

slide-8
SLIDE 8

Eugene, Oregon – BRT $445,000

8

Hampton Roads – LRT $762,000 Charlotte, NC – LRT $757,000 Grand Rapids, MI BRT $662,000

Transit Stations in Other Cities

slide-9
SLIDE 9

Completed:

  • 1. Community

feedback

  • 2. Design review

Still underway:

  • 3. Performance and

financial review

9

Status of Review

slide-10
SLIDE 10

Surveyed actual users and residents

  • 732 completed surveys
  • Five stakeholder group

meetings

  • 50 emails reviewed

10

Community Feedback

Included 515 users of the Walter Reed station

Goal: Listen to what the public had to say about the prototype, to inform the design review.

slide-11
SLIDE 11

11

A number of users and residents commented that the cost was too high.

Results of Community Feedback

slide-12
SLIDE 12

Design Review

Included:

– Review of community feedback – Analysis of prototype design and function – Technical working group of County staff from multiple disciplines – Multiple alternative designs – Reviewed life cycle costs of final alternatives

12

slide-13
SLIDE 13

What we improved:  Better canopy coverage

 Better pedestrian circulation  Improved ADA accessibility  Better seating  “Kit of parts” design (modular)

What we kept:  Passenger amenities

 Real-time information  Lighting  Design aesthetics

13

Results of Design Review

slide-14
SLIDE 14

14

Transit Stations - Optimized Design

slide-15
SLIDE 15

Transit Station Design Features

15

Better canopy coverage with lighting Improved accessibility Better seating Real-time information displays

slide-16
SLIDE 16

Comparison of Features

Walter Reed Prototype Recommended Transit Station (Standard size) Improvement from Prototype Canopy coverage (sq. ft.)

243 295

Larger and lower canopy with reduced angle = Improved weather protection Canopy height (feet)

+- 13 +- 10

Canopy angle (degrees)

10 1.5

Seating capacity (persons)

4 covered 3 uncovered 6 covered

Increased covered seating Covered standing capacity (persons)

+- 13 25 (+ 2 handicap spaces)

Increased & more ADA accessible

16

slide-17
SLIDE 17

Simplified the design – Modular, flexible – can be scaled up or down – Standardized components – Less structure, less steel – Eliminated ice melt system – Scaled program to ridership

17

How We Cut Costs

Cheaper to build Cheaper to maintain

slide-18
SLIDE 18

Cost Estimate

18

Optimized Design conceptual cost estimate Transit Station – Standard size Construction, includes:  Canopy, structure, foundation  Amenities – benches, signs, lighting, real- time information signs, landscaping  Site clearing, utility relocation, electrical $361,000 * Site design and project management $108,000 Total $469,000

* Construction cost includes a 30 percent contingency, typical for a concept design.

slide-19
SLIDE 19

Construction Cost Breakdown

19

Structure: $192,000 Supporting infrastructure: $169,000

Estimated Construction Cost (Standard size): $361,000

slide-20
SLIDE 20

Transit Stations Program

Station Size Estimated Cost* # of Stations Total Cost Standard $469,000 9 $4.2 M Single $362,000 8 $2.9 M Constrained $397,000 2 $0.8 M Extended (Double Standard) $672,000 4 $2.7 M Subtotal $10.6 M Contingency $1.8 M Program Total 23 $12.4 M

20

* Each estimate includes site design, project management and construction costs.

slide-21
SLIDE 21

21

Program Funding

Federal = 38% $8 million State = 24% $5.1 million Local - TCF= 33% $6.8 million Local - G.O. Bond = 5% $1 million Local - G.O. Bond = 6% $800,000 Federal = 52% $6.4 million State = 14% $1.7 million Local - TCF= 28% $3.5 million

Note: Local - TCF is Arlington County’s Transportation Capital Fund, which is dedicated transportation revenue from the commercial and industrial real estate tax.

2013 CIP = $20.9 million

(24 stations)

2015 CIP = $12.4 million

(23 stations)

slide-22
SLIDE 22

We have:

 Cut standard-size station cost significantly  Reduced program costs by 40%  Developed a better design that shelters more people  Taken over project management  Incorporated lessons learned  Stayed true to the goal of providing great transit for the Pike

22

Summary

slide-23
SLIDE 23
  • 1. Work with WMATA to

complete performance and financial review and report results

  • 2. Develop phased plan for

building remaining 23 transit stations

  • 3. Design and construct next

eight transit stations

  • Consult community

stakeholder groups during design

23

Next Steps

slide-24
SLIDE 24

For more information: www.columbiapikeva.us/transit-stations/ Includes summary report and community process and design review reports.

24

Columbia Pike Transit Stations