
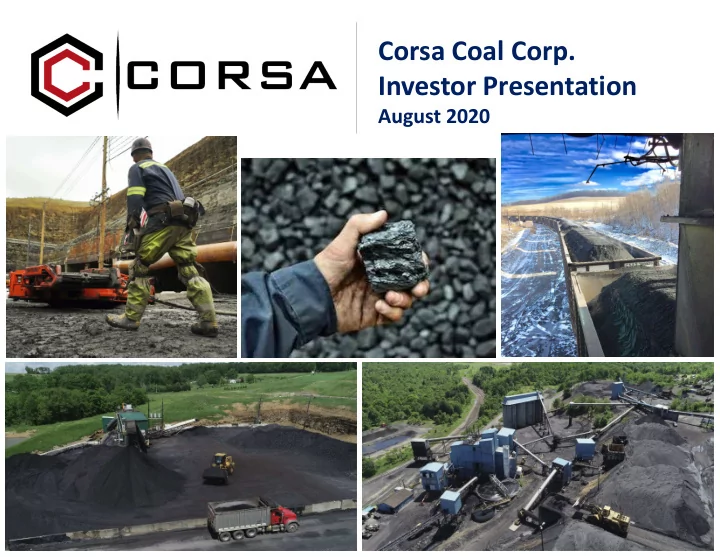
SLIDE 1
Corsa Coal Corp. Investor Presentation
August 2020
Corsa Coal Corp. Investor Presentation August 2020 Forward Looking - - PowerPoint PPT Presentation
Corsa Coal Corp. Investor Presentation August 2020 Forward Looking Information and Statements TSX-V: CSO | OTCQX: CRSXF Certain information set forth in this Presentation contains forward-looking statements and forward-looking
August 2020
TSX-V: CSO | OTCQX: CRSXF
Certain information set forth in this Presentation contains “forward-looking statements” and “forward-looking information” (collectively, “forward-looking statements”) under applicable securities laws. Except for statements of historical fact, certain information contained herein relating to price volatility of the metallurgical coal market, the future demand for metallurgical coal and the availability of its supply constitutes forward-looking statements which include management’s assessment of future plans and operations and are based on current internal expectations, assumptions and beliefs, which may prove to be
“plans”, “capacity”, “hope”, “forecast”, “anticipate”, “could” and similar expressions. These statements are not guarantees of future performance and undue reliance should not be placed on them. Such forward-looking statements necessarily involve known and unknown risks and uncertainties. These risks and uncertainties include, but are not limited to: changes in market conditions, governmental or regulatory developments as a result of the COVID-19 pandemic or
coal products, including labor stoppages, the outbreak of disease and severe weather conditions; and management’s ability to anticipate and manage the foregoing factors and risks. There can be no assurance that forward-looking statements will prove to be accurate, as actual results and future events could differ materially from those anticipated in such statements. The reader is cautioned not to place undue reliance on forward-looking statements. Corsa does not undertake to update any of the forward-looking statements contained in this Presentation unless required by law. The statements as to Corsa’s capacity to produce coal are no assurance that it will achieve these levels of production or that it will be able to achieve these sales levels.
1
Forward Looking Information and Statements
TSX-V: CSO | OTCQX: CRSXF
Non-GAAP Measures
Management uses realized price per ton sold, cash production cost per ton sold, cash cost per ton sold, cash margin per ton sold, EBITDA and adjusted EBITDA as internal measurements of financial performance for Corsa’s mining and processing operations. These measures are not recognized under International Financial Reporting Standards (“GAAP”). Corsa believes that, in addition to the conventional measures prepared in accordance with GAAP, certain investors and other stakeholders also use these non-GAAP financial measures to evaluate Corsa’s operating and financial performance; however, these non-GAAP financial measures do not have any standardized meaning and therefore may not be comparable to similar measures presented by other issuers. Accordingly, these non-GAAP financial measures are intended to provide additional information and should not be considered in isolation or as a substitute for measures of performance prepared in accordance with GAAP. Reference is made to the management’s discussion and analysis for the three and six months ended June 30, 2020 for a reconciliation and definitions of non-GAAP financial measures to GAAP measures. Corsa defines adjusted EBITDA as EBITDA (earnings before deductions for interest, taxes, depreciation and amortization) adjusted for change in estimate of reclamation provision for non-operating properties, impairment and write-off of mineral properties and advance royalties, gain (loss) on sale of assets and other costs, stock-based compensation, non-cash finance expenses and other non-cash adjustments. Adjusted EBITDA is used as a supplemental financial measure by management and by external users of our financial statements to assess our performance as compared to the performance of other companies in the coal industry, without regard to financing methods, historical cost basis or capital structure; the ability of our assets to generate sufficient cash flow; and our ability to incur and service debt and fund capital expenditures. Other Matters Unless otherwise noted, all dollar amounts in this presentation are expressed in United States dollars and all ton amounts are short tons (2,000 pounds per ton). Pricing and cost per ton information is expressed on a free-on-board, or FOB, mine site basis, unless otherwise noted. On January 30, 2020, the World Health Organization declared the COVID-19 outbreak a “Public Health Emergency of International Concern” and on March 11, 2020, declared COVID-19 a pandemic. The current COVID-19 pandemic is significantly impacting the global economy and commodity and financial markets. The full extent and impact of the COVID-19 pandemic is unknown, and rapidly evolving. Given the extreme volatility in financial markets and commodity prices, along with uncertainty regarding the impact thereof on the performance of the Company, the Company does not believe it is appropriate to issue full year guidance at this time for fiscal 2020 or to provide additional forward-looking information. The Company will continue to evaluate events and circumstances and will provide guidance and other forward-looking information when appropriate and as information is available. Other than as otherwise described on slide 15, all scientific and technical information contained in this news release has been reviewed and approved by Peter
for Mineral Projects.
2
Additional Information
TSX-V: CSO | OTCQX: CRSXF
Corsa Coal Overview
metallurgical coal prices
Strong Record of Growth, Shifting to Harvest Phase
Corsa Operations
Pennsylvania
Baltimore Norfolk
High Quality Ownership
reserves in the United States
3
Currently trading at a 1.1x multiple of trailing twelve months Adjusted EBITDA(1)
Market Cap: $15 million (1) Enterprise Value: $22 million (1)
(1) As of July 31, 2020
Metallurgical Coal Sales 1st Half 2020 2019 Low Vol Sales Tons (margin generating) 0.754 million 1.552 million Sales & Trading Tons (pass-through) 0.136 million 0.281 million Total Metallurgical Sales Tons 0.890 million 1.833 million Low Vol Sales Tons Mix: % Domestic 37% 37% Low Vol Sales Tons Mix: % Export 63% 63%
TSX-V: CSO | OTCQX: CRSXF
NAPP Division Overview
NAPP Division Operating Locations Producer-Trader Model
loadouts
Infrastructure Pittsburgh 70 miles NW of Somerset
4
Baltimore 180 miles SE of Somerset
Casselman Acosta Horning Surface VAS S&T Company Mine (Produced) Value Added Services (Purchased) Sales & Trading (Purchased)
TSX-V: CSO | OTCQX: CRSXF
Corsa Coal Revenue Streams
Company Produced Tons
Definition: Coal that we mine from our operational sites and sell to customers.
Value Added Services Tons
Definition: Coal that we purchase locally on a raw basis and wash, store, blend and load. Placed on existing Corsa sales orders.
Sales & Trading Tons
Definition: Coal purchased typically from the Central Appalachia region on a finished basis and blended at the port for export customers. Coal blends create customized products to meet customer needs.
5
% of 1st Half 2020 Tons Sold: 81% % of 1st Half 2020 Gross Margin: 97% % of 2019 Tons Sold: 71% % of 2019 Gross Margin: 87%
Low Vol Met Coal Margin Generating Passes through Prep Plants
% of 1st Half 2020 Tons Sold: 4% % of 1st Half 2020 Gross Margin: 3% % of 2019 Tons Sold: 14% % of 2019 Gross Margin: 13%
High Vol Met Coal Purchased from 3rd Parties Pass-through Profitability
% of 1st Half 2020 Tons Sold: 15% % of 1st Half 2020 Gross Margin: 0% % of 2019 Tons Sold: 15% % of 2019 Gross Margin: 0%
Source: Company filings
TSX-V: CSO | OTCQX: CRSXF
Revenue Stream 1: Company Produced Tons
Corsa’s mines produced 1.355 million tons in 2019 and 0.753 million tons in 1st Half 2020 Casselman
1st Half 2020: 343,000 tons 2019: 635,000 tons Reserves: 3.0 million tons(1) 1st Half 2020: 220,000 tons 2019: 401,000 tons Reserves: 15.0 million tons (1) 1st Half 2020: 100,000 tons 2019: 181,000 tons Reserves: 2.0 million tons (1) 1st Half 2020: 90,000 tons 2019: 138,000 tons Reserves: 1.1 million tons (1) Company Produced Tons: Quarterly Production History (2017 –2020)
6
Source: Company filings (1) Reserves are based on the Technical Report dated December 31, 2019. See slide 16.
Acosta Horning Surface Mines
TSX-V: CSO | OTCQX: CRSXF
Growth Project: Keyser Deep Mine Profile
Mine Summary Information Keyser Location
7
Expected Production Tonnage Profile: First Five Years
TSX-V: CSO | OTCQX: CRSXF
Revenue Stream 2: Value Added Services Tons
Corsa is in the 5th inning of its organic growth plan and is focused on the development of the high-returning Keyser and North mines
8
Corsa’s Value Added Services for Local Purchased Coal
Storing Blending Loading Washing
launched in October 2016.
tons purchased on a raw basis and trucked to Corsa’s preparation plants.
coal on Corsa sales orders.
and quality reasons. Provides exposure to the export market for Corsa’s suppliers.
plants absorbs fixed costs and lowers per unit costs.
Source: Company filings.
Historical VAS Purchased Coal Volumes in tons
TSX-V: CSO | OTCQX: CRSXF
Revenue Stream 3: Sales & Trading Tons
coal suppliers
adjusted to customer needs
US East Coast
9
1st Half 2020 Share Total Metallurgical Coal Sales Tons % Domestic of 0.890 million total tons 31% % Export of 0.890 million total tons 69% 2019 Share Total Metallurgical Coal Sales Tons % Domestic of 1.833 million total tons 30% % Export of 1.833 million total tons 70%
Source: Company filings.
TSX-V: CSO | OTCQX: CRSXF
Organic Growth Plan and Historical Margin Profile
Organic Growth Success (Company Produced + VAS)
10
Price and Margins per Ton
Catalysts for Future Margin Expansion
active mines are fully ramped up
and Schrock Run move past the development into full run-rate production
from addition of high quality tons from Horning and Schrock Run
east coast ports are less congested
10
Corsa’s Organic Growth
run-rate production levels in 2019
first full year of run-rate production is 2020
scale and reduction in capital expenditures
present next
considered for further growth
(1) This is a non-GAAP measure. See slide 2.
Source: Company filings
TSX-V: CSO | OTCQX: CRSXF
Balance Sheet Summary
11
Asset Retirement Obligations (ARO)
ARO Cash Expenditures Net ARO Liabilities Balance Sheet Key Points
$mm 2017 2018 2019 1st Half 2020 Growth $18.8 $11.8 ($0.2) $0.2 Maintenance $6.4 $9.5 $7.6 $0.8 Total CapEx $25.2 $21.3 $7.4 $1.0
Source: Company filings.
Capital Expenditures
Note: Assumes discount rates of 0.16%-2.25%
$mm As of: 12/31/2019 6/30/2020 Change Cash $4.3 $15.0 $10.7 Revolver Availability $6.7 $6.8 $0.1 Net Working Capital $16.3 $13.4 ($2.9) Revolver $14.5 $0.0 ($14.5) Loan Payable $0.0 $8.4 $8.4 Lease Liabilities $14.4 $13.5 ($0.9) Total Debt $28.9 $21.9 ($7.0) Total Assets $269.3 $204.5 ($64.8) Total Liabilities $118.2 $100.2 ($18.0) Total Equity $151.1 $104.2 ($46.9)
TSX-V: CSO | OTCQX: CRSXF
Leverage to metallurgical coal prices and growth potential Track record of growth, FCF positive producer trading at 1.1x trailing twelve months Adjusted EBITDA
12
TSX-V: CSO | OTCQX: CRSXF
TSX-V: CSO | OTCQX: CRSXF 14
Financial Highlights
Total Year Total Year Q1 Q2 Q3 Q4 Total Year Q1 Q2 1st Half 2017 2018 2019 2019 2019 2019 2019 2020 2020 2020 Revenues ($ million) $217.4 $265.8 $57.3 $63.0 $58.1 $52.5 $230.9 $46.7 $40.9 $87.6 Adjusted EBITDA(1) ($ million) $47.8 $35.0 $9.2 $10.1 $6.1 $3.5 $28.9 $6.4 $4.3 $10.7 Capital Expenditures - Maintenance ($ million) $6.4 $9.6 $1.8 $2.0 $2.4 $1.4 $7.6 $0.5 $0.3 $0.8 Capital Expenditures - Growth ($ million) $18.8 $11.9
$0.4 $0.2 $0.0
$0.0 $0.2 $0.2 Metallurgical Coal Sales Average Realized Price / Metallurgical Ton Sold(1) $125.56 $114.50 $116.47 $117.48 $97.98 $86.70 $103.76 $90.49 $82.72 $86.64 Sales Volumes (short tons) Company Produced Tons 811,905 981,669 280,657 319,202 282,591 418,794 1,301,244 384,750 336,928 721,678 Corsa Value Added Services Tons 316,835 403,560 78,197 94,903 56,246 21,292 250,638 29,576 2,426 32,002 Sales & Trading Tons 346,158 486,876 49,982 36,306 126,304 68,879 281,471 34,587 102,076 136,663 Total Metallurgical Coal Tons Sold 1,474,898 1,872,105 408,836 450,411 465,141 508,965 1,833,353 448,913 441,430 890,343 Cash Cost / Metallurgical Ton Sold(1) Cash Production Cost Per Ton Sold(2) $74.18 $83.61 $83.21 $84.55 $77.91 $73.87 $79.38 $71.12 $63.04 $67.35 Cash Cost per Ton Sold $84.45 $88.59 $86.18 $88.66 $80.28 $74.59 $82.07 $71.61 $68.12 $69.88 Cash Margin per Metallurgical Ton Sold(1) $41.11 $25.91 $30.29 $28.82 $17.70 $12.11 $21.69 $18.88 $14.60 $16.76
(1) This is a non-GAAP measure. See slide 2. (2) Excludes Purchased Coal
Source: Company filing.
TSX-V: CSO | OTCQX: CRSXF 15
Technical Report
The mineral reserve and resource estimates relating to Corsa’s properties, which are effective as of December 31, 2019, have been prepared by Marshall Miller & Associates, Inc. (“MM&A”) under the supervision of Justin S. Douthat, P.E., M.B.A. and John W. Eckman, C.P.G., each a qualified person, as such term is defined in National Instrument 43-101 – Standards of Disclosure for Mineral Projects (“NI 43-101”). MM&A is independent
pursuant to NI 43-101 by MM&A under Corsa’s profile at www.sedar.com entitled “Technical Report on the Coal Resource and Coal Reserve Controlled by Corsa Coal Corp., Pennsylvania and Maryland, USA - Prepared in Accordance with National Instrument 43-101 Standards for Disclosure for Mineral Projects Effective December 31, 2019” (the “NAPP Technical Report”). Reserves are clean recoverable tons. Cautionary Statement Regarding Estimates of Mineral Reserves This document sets forth certain estimates of “reserves” and “resources”. While Corsa believes that the estimates were based on methodologies acceptable in Canada pursuant to NI 43-101, such estimates are not synonymous with the United States Securities and Exchange Commission (“SEC”) Industry Guide 7 as discussed below. NI 43-101 is a rule developed by the Canadian Securities Administrators that establishes standards for all public disclosure an issuer makes in Canada of scientific and technical information concerning mineral projects. Of note to U.S. investors, these standards differ significantly from the requirements of the SEC (including under its Industry Guide 7). Under U.S. standards, mineralization may not be classified as a “reserve” unless the determination has been made that the mineralization could be economically and legally produced or extracted at the time the reserve determination is made. U.S. investors are cautioned not to assume that all
they may have. Accordingly, information concerning descriptions or mineralization, “resources” and “reserves” contained in this AIF are not comparable to information made public by U.S. companies subject to the reporting and disclosure requirements of the SEC.
TSX-V: CSO | OTCQX: CRSXF 16
Coal Reserves
Source: Technical Report dated December 31, 2019.
43-101 Properties as of 12/31/2019 mnt Proven Probable Total Permitted Not Permitted Surface-mineable 932
932
145
145
29,814 9,409 39,223 17,856 21,367 Total 30,890 9,409 40,299 18,933 21,367 Casselman (UG) 2,249 789 3,038 3,038
3,296 1,207 4,503 954 3,549 Acosta (UG)
7,884 1,575 9,459
Middle Kittanning 4,020 1,517 5,537 5,537
11,904 3,092 14,995 5,537 9,459 Keyser (UG) 4,825 3,496 8,321
Horning (UG) 1,950 16 1,966 1,966
5,590 810 6,400 6,362 38 All Other 1,077 1,077 1,077 Total 30,890 9,409 40,299 18,933 21,367
TSX-V: CSO | OTCQX: CRSXF 17
Coal Qualities
Source: Technical Report dated December 31, 2019. 43-101 Properties as of 12/31/2019 Weighted Composite (Moist Basis) Reserve Area Seam Wash Recovery (%) Ash (%) Sulfur (%) Btu/lb. Volatile Matter (%) Surface-Mineable Rhoades Upper Kittanning 96.66% 9.85% 0.57% 13,109
Middle Kittanning 91.66% 20.74% 2.45% 12,110
Lower Kittanning 91.45% 16.76% 3.11% 12,870
Lower Freeport 95.00% 7.83% 0.73% 14,196
Upper Kittanning 92.34% 11.98% 1.94% 13,617
Upper Kittanning 89.57% 13.71% 2.19% 13,234
Middle Kittanning 84.63% 16.49% 2.64% 5,425
92.98% 12.30% 1.77% 13,337
Gaz Upper Kittanning 87.00% 18.53% 2.35% 12,289
Upper Kittanning 96.66% 9.85% 0.57% 13,109
Middle Kittanning 91.66% 20.74% 2.45% 12,110
Lower Kittanning 93.10% 16.78% 3.11% 12,882
Lower Freeport 95.00% 1.83% 0.73% 14,196
Upper Kittanning 92.34% 11.98% 1.94% 13,617
Upper Freeport 88.01% 17.67% 1.36%
Middle Kittanning 84.63% 16.49% 2.64% 5,425
91.94% 13.59% 1.98% 13,039
North Upper Freeport 81.17% 6.98% 1.01% 13,450 16.20% Casselman Upper Freeport 81.17% 6.98% 1.01% 13,450 16.20% Acosta Upper Kittanning 78.63% 9.03% 1.61% 13,002 19.70% Acosta Middle Kittanning 63.20% 11.28% 1.17% 12,601 15.40% Acosta Lower Kittanning 65.67% 10.18% 1.79% 12,812 17.40% Horning Lower Freeport 90.49% 5.99% 1.01% 14,710 17.60% Keyser Lower Kittanning 74.06% 6.68% 1.37% 13,402 18.90% A Seam Brookville 56.03% 10.07% 0.79% 12,698 17.90% Total 72.88% 8.47% 1.22% 13,153 17.85% Total 73.40% 8.58% 1.23% 13,156 17.85%