
SLIDE 1
s t a t i s t i c s o f t w o v a r i a b l e s
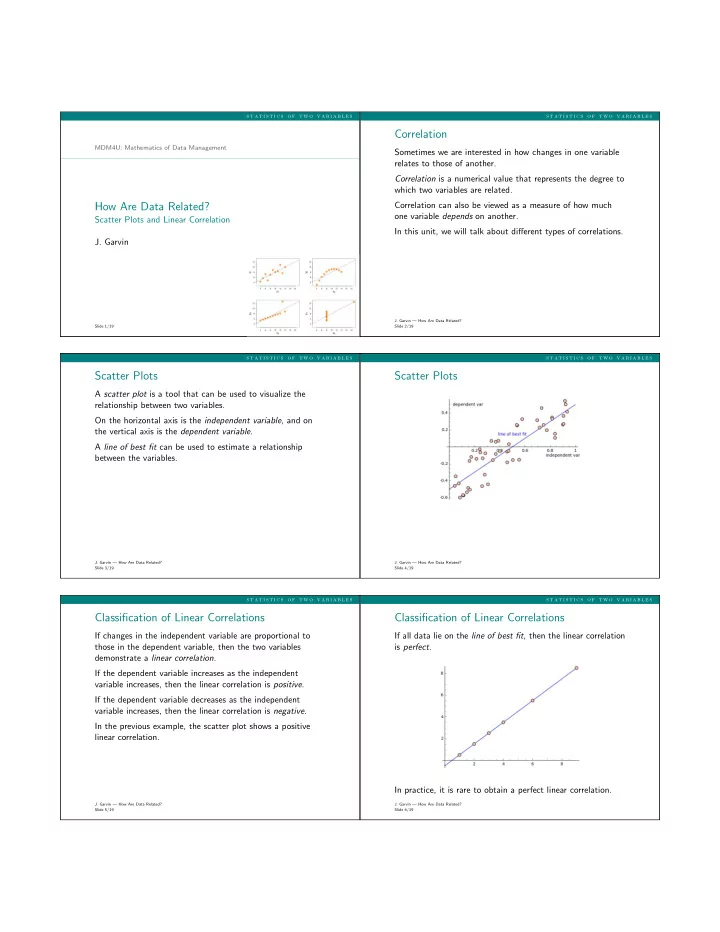
MDM4U: Mathematics of Data Management
How Are Data Related?
Scatter Plots and Linear Correlation
- J. Garvin
Slide 1/19
s t a t i s t i c s o f t w o v a r i a b l e s
Correlation
Sometimes we are interested in how changes in one variable relates to those of another. Correlation is a numerical value that represents the degree to which two variables are related. Correlation can also be viewed as a measure of how much
- ne variable depends on another.
In this unit, we will talk about different types of correlations.
- J. Garvin — How Are Data Related?
Slide 2/19
s t a t i s t i c s o f t w o v a r i a b l e s
Scatter Plots
A scatter plot is a tool that can be used to visualize the relationship between two variables. On the horizontal axis is the independent variable, and on the vertical axis is the dependent variable. A line of best fit can be used to estimate a relationship between the variables.
- J. Garvin — How Are Data Related?
Slide 3/19
s t a t i s t i c s o f t w o v a r i a b l e s
Scatter Plots
- J. Garvin — How Are Data Related?
Slide 4/19
s t a t i s t i c s o f t w o v a r i a b l e s
Classification of Linear Correlations
If changes in the independent variable are proportional to those in the dependent variable, then the two variables demonstrate a linear correlation. If the dependent variable increases as the independent variable increases, then the linear correlation is positive. If the dependent variable decreases as the independent variable increases, then the linear correlation is negative. In the previous example, the scatter plot shows a positive linear correlation.
- J. Garvin — How Are Data Related?
Slide 5/19
s t a t i s t i c s o f t w o v a r i a b l e s
Classification of Linear Correlations
If all data lie on the line of best fit, then the linear correlation is perfect. In practice, it is rare to obtain a perfect linear correlation.
- J. Garvin — How Are Data Related?
Slide 6/19