
SLIDE 1
www.esselpropack.com M180618 www.esselpropack.com
Corporate Presentation www.esselpropack.com M180618 - - PowerPoint PPT Presentation
Corporate Presentation www.esselpropack.com M180618 www.esselpropack.com Safe Harbour Certain statements in this presentation concerning our future growth prospects are forward-looking statements. The Company cautions that, by their nature,
www.esselpropack.com M180618 www.esselpropack.com
www.esselpropack.com
Certain statements in this presentation concerning our future growth prospects are forward-looking statements. The Company cautions that, by their nature, forward- looking statements involve risks and uncertainties that could cause actual results to differ materially from those in such forward-looking statements. The risks and uncertainties relating to these statements include, but are not limited to, risks and uncertainties regarding fluctuations in earnings, our ability to manage growth, intense competition in packaging industry including those factors which may affect our cost advantage, wage increases, our ability to attract and retain highly skilled professionals, time and cost overruns on fixed-price, fixed-time frame contracts, client concentration, industry segment concentration, our ability to manage our operations, reduced demand for packaging products in our key focus areas, our ability to successfully complete and integrate potential acquisitions, liability for damages on our service contracts, the success of the companies in which Essel Propack has made strategic investments, withdrawal of governmental fiscal incentives, political instability and regional conflicts, legal restrictions on raising capital or acquiring companies, and unauthorized use of our intellectual property and general economic conditions affecting our industry. The company does not undertake to update any forward-looking statements that may be made from time to time by or on behalf of the company.
2
www.esselpropack.com
3
www.esselpropack.com
> Leading global specialty packaging company - FY18 Turnover of USD 375 Million, manufacturing circa 8 billion laminated tubes catering to renowned FMCG/Pharma brands across categories of Beauty & Cosmetics, Pharma & Health, Food, Oral Care & Home Care. > One of the only two global players in the tube space, and the world’s largest manufacturer of laminated tubes. > Market leader in Oral care tubes with global volume share of 36% > Growing in the Non- oral care tubes and driving market transition from the current extruded plastic & aluminum tube formats to the new generation laminated tubes > R&D and Technology driving innovations in products and processes
4
All figures converted at March 18 closing USD/ INR rate @ 65.1750
www.esselpropack.com
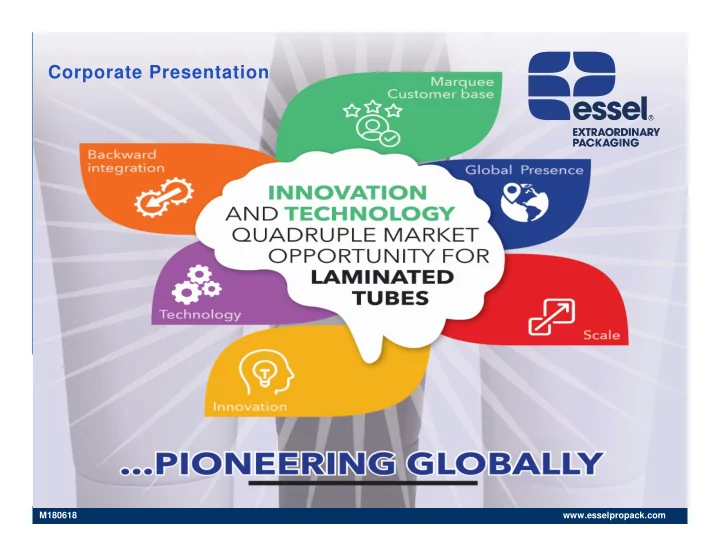
> Employs over 3172 people from 25 different nationalities at 19 state-of- the-art facilities in eleven countries across all continents > Marquee customer base of global, regional and local niche brands. > Backward integrated manufacturer – from blown film to tubes > Listed on the NSE and the BSE in India for 35 years since inception - Market Capitalization USD 580 Million at March 31, 2018
5
All figures converted at March 18 closing USD/ INR rate @ 65.1750
www.esselpropack.com
6
Beauty & Cosmetics
Beauty Creams Face Creams Body Lotion Face Scrub Skin Creams Lip Balms Dilapilatories Hair Conditioners Shampoos Hair Colorants
Pharma & Health
Ophthalmic OTC Gel/ Ointments Prescription Drugs
Food
Cheese Jam Mayonnaise Wasabi Condensed Milk
Home
Adhesives Paints Crayons Shoe Polish
Oral Care
Toothpaste Therapeutic/ Cosmetic Dental Products Dental Fixtures
www.esselpropack.com
7
Polymers Multilayer Films Extrusion Lamination Laminates Slitting Decoration Tubing Shouldering Capping Final Tube
Laminated Tubes
www.esselpropack.com
8
Shouldering Decoration Capping Final Tube Polymers Mono/ Multi Layer Sleeves Cutting
Plastic Tubes
www.esselpropack.com
9
Caps & Closures Plastic Tubes Tube Laminates Laminated Tubes
www.esselpropack.com
10
> A state of art C&I rolls out continuous product innovations in Barrier layers, Laminate structure, Look & Feel, Decoration, Security features, Dispensers with Focus on Product safety, Brand value enhancement, Resource reduction, Sustainability, Recyclability. > Partnering with Strategic suppliers of Raw material for improved functionality and efficacy > Partnering with equipment suppliers to develop new technology platforms, enhanced productivity, advanced product features etc > Over 142 patent applications globally (granted already 38) ‘Etain’ Efficient Recycling & consequent reduced carbon foot print ‘Velvetie’ Soft Touch & Feel tube ‘Prizm’ Holographic printed tube ‘EGNITE’ High Metallic sheen ‘Green Maple Leaf–C2’ 100% recyclable tube ‘Clarion’ very high clear UV protected tube
www.esselpropack.com
11
categories opened up with our new generation laminated tubes which offer superior value proposition v/s plastic and aluminium tubes and bottles
volume and quadruples in value terms
www.esselpropack.com
11 Countries
12
19 Factories 3172 Employees
Germany UK Mexico USA Poland India (6) Colombia Philippines Indonesia Russia China (5) Egypt Russia
1993 1982 1997 1999 2000 2000 2000 2000 2003 2004 2004 2007
Laminated Tubes Plastic Tubes Greenfield Acquisition
Growth thru a mix of pioneering greenfield and synergistic acquisitions Operates thru WOS in all Countries except Egypt (75%) & Indonesia 30% - Associate
Laminates Caps
www.esselpropack.com
13
www.esselpropack.com
As on 31st March 2018
14
57% 15% 5% 23%
Promoters FII DII Non Institution
Large institutional shareholder base comprising ~20%
www.esselpropack.com
15
www.esselpropack.com
> To be the Global Supplier of Choice by providing value added, innovative & sustainable packaging solutions to a range of market sectors with customer service second to none > To be a workplace where Passion, Empowerment and Creativity is nurtured by shared values, internal systems & processes > To exhibit responsible behavior & create value for all our stakeholders
Innovation
Commitment to Excellence Leadership & Achievement Customer Care Integrity Safety
Mutual Trust, Respect & Team work
16
www.esselpropack.com
Germany UK Mexico USA Poland India Colombia Philippines Russia China Egypt Russia Laminated Tubes Plastic Tubes
Americas (USA, Columbia, Mexico) Europe (UK, Germany, Poland, Russia) Africa, Middle East & South Asia ‘AMESA’ (India, Egypt) East Asia Pacific ‘EAP’ (China, Philippines)
17
www.esselpropack.com
18
FY 18
46% 30% 20% 4%
EBIT Break up %
AMESA EAP AMERICAS EUROPE 37% 23% 19% 21%
Revenue (Net of Excise) Break up %
AMESA EAP AMERICAS EUROPE
www.esselpropack.com
19
> Five member Board of which 3 are Independent Directors > Professional Management team > Advanced IT systems > Strong Processes
Board of Directors Chairman & Managing Director Global Functional Heads COO Regional Vice Presidents Regional/ Unit Teams Global Functional Heads
CFO HR CIO C & I (Proj) Europe Americas EAP AMESA
Supply Chain Technology Quality
Legal C & I
www.esselpropack.com
20
www.esselpropack.com
Pioneer laminated tubes for toothpaste in India, to become Market leader
“Go and Grow with Customers” , to become a Global leader for toothpaste tubes with multi- country operations
And now,
Pioneer new generation laminated tubes in place of extruded plastic/ aluminum tubes and bottles for non oral care categories, leveraging R&D
Deploy Technology to drive up Productivity, Quality and Customer experience so as to create sustained competitive advantage
Actively Promote Sustainability in the Tube space
21
www.esselpropack.com
22
www.esselpropack.com
Revenue & EBIDTA Revenue and PAT (Index 2012)
line beginning FY16, no impact for profit
Revenue figures are net of excise duty For Continuing Business
23
All figures converted at March 18 closing USD/ INR rate @ 65.1750 March 2016, March 2017 and March 2018 on IND AS basis earlier years on IGAAP basis
210 246 289 318 319 353 372 37 43 51 58 62 65 73 8 11 15 20 25 29 26 20 40 60 80 150 300 450 Mar-12 Mar-13 Mar-14 Mar-15 Mar-16 Mar-17 Mar-18 Revenue EBIDTA PAT
USD Mn
100 117 138 152 152 168 177 100 134 186 246 303 351 316 200 400 Mar-12 Mar-13 Mar-14 Mar-15 Mar-16 Mar-17 Mar-18 Revenue (Mar-12 Index 100) PAT (Mar-12 Index 100)
www.esselpropack.com
Revenue Share by Geography EBIT Share by Geography
> Europe continue to expand > Latin America expansion and new contracts drive Americas business > EAP and AMESA sustained contributors to Revenue and EBIT
24
Revenue figures are net of excise duty For Continuing Business All figures converted at March 18 closing USD/ INR rate @ 65.1750 March 2016, March 2017 and March 2018 on IND AS basis earlier years on IGAAP basis
37% 36% 35% 37% 38% 38% 37% 26% 25% 25% 25% 25% 23% 23% 26% 25% 23% 22% 21% 20% 20% 12% 14% 16% 17% 16% 18% 21% 0% 30% 60% 90% 120% Mar-12 Mar-13 Mar-14 Mar-15 Mar-16 Mar-17 Mar-18 AMESA EAP Americas Europe 57% 55% 52% 47% 44% 45% 46% 50% 46% 37% 27% 29% 28% 30% 10% 15% 15% 19% 20% 19% 20%
7% 7% 9% 4%
10% 60% 110% 160% Mar-12 Mar-13 Mar-14 Mar-15 Mar-16 Mar-17 Mar-18 AMESA EAP Americas Europe
www.esselpropack.com
AMESA EAP Americas Europe
USD Mn USD Mn USD Mn USD Mn
25
Revenue figures are net of excise duty For Continuing Business All figures converted at March 18 closing USD/ INR rate @ 65.1750 March 2016, March 2017 and March 2018 on IND AS basis earlier years on IGAAP basis
81 94 106 121 128 137 140 12 15 18 19 20 20 22 15 30 60 120 180 Mar-12 Mar-13 Mar-14 Mar-15 Mar-16 Mar-17 Mar-18 Revenue EBIT 57 65 76 82 84 85 88 11 12 12 11 13 12 14
2 6 10 14 18 30 60 90 120 Mar-12 Mar-13 Mar-14 Mar-15 Mar-16 Mar-17 Mar-18 Revenue EBIT 57 65 70 73 72 74 75 2 4 5 7 9 8 9
2 6 10 30 60 90 Mar-12 Mar-13 Mar-14 Mar-15 Mar-16 Mar-17 Mar-18 Revenue EBIT 27 37 48 55 53 67 78 (1) 3 3 4 2
2 6 30 60 90 Mar-12 Mar-13 Mar-14 Mar-15 Mar-16 Mar-17 Mar-18 Revenue EBIT
www.esselpropack.com
At average USD/INR exchange rate for the year Profit from operating activities as per cash flow statement
> Strong improvement in Return on Equity (ROE) and Capital Employed (ROCE), creating value for stakeholders > EPS 6Y CAGR 22.3%. ROE, ROCE, EPS
26
March 2016, March 2017 and March 2018 on IND AS basis earlier years on IGAAP basis
3.3 5.2 6.9 9.0 11.6 12.1 10.9 10% 12% 14% 16% 18% 18% 17% 6% 9% 13% 19% 20% 19% 15% 1 2 3 4 5 6 7 8 9 10 11 12 0% 2% 4% 6% 8% 10% 12% 14% 16% 18% 20% 22% Mar-12 Mar-13 Mar-14 Mar-15 Mar-16 Mar-17 Mar-18 EPS ROCE ROE (INR)
EPS (INR)
www.esselpropack.com
flows
27
All figures converted at March 18 closing USD/ INR rate @ 65.1750 March 2016, March 2017 and March 2018 on IND AS basis earlier years on IGAAP basis
6 7 12 15 25 21 31 30 26 29 48 55 57 53 10 20 30 40 50 60 70 80 90 100 110 120 Mar-12 Mar-13 Mar-14 Mar-15 Mar-16 Mar-17 Mar-18 Free Cash Flow Operating Cashflow
USD Mn
www.esselpropack.com
> Debt Equity Ratio and Interest Cover healthy & improving. > AA rated for long term debt. > A1+ RATED (Top rating) for short term debt. > Active in Commercial Paper & Listed privately placed NCD’s. > Effective interest cost reduced by 4.4 pp to 5.8 % in this period
28 USD Mn
Net Debt, Interest Cover, Debt/Equity
All figures converted at March 18 closing USD/ INR rate @ 65.1750 March 2016, March 2017 and March 2018 on IND AS basis earlier years on IGAAP basis
130 133 135 130 99 107 85 1.9 2.4 3.0 3.5 5.1 5.6 5.7 1.8 1.7 1.5 1.3 0.8 0.8 0.6 1 2 3 4 5 6 7 25 50 75 100 125 150 Mar-12 Mar-13 Mar-14 Mar-15 Mar-16 Mar-17 Mar-18 Net Debt Interest Cover Debt/ Equity
www.esselpropack.com
29
March 2016, March 17 and March 2018 on IND AS basis earlier years on IGAAP basis
19.3% 17.0% 21.3% 21.4% 24.5% 23.8% 26.4% 3.3 5.2 6.9 9.0 10.5 12.1 10.9 0.7 0.8 1.3 1.6 2.2 2.4 2.4
4.0 6.0 8.0 10.0 12.0 14.0 0.00% 5.00% 10.00% 15.00% 20.00% 25.00% 30.00% Mar-12 Mar-13 Mar-14 Mar-15 Mar-16 Mar-17 Mar-18 Payout Ratio EPS (Rs) DPS (Rs)
Payout Ratio DPS / EPS - (Rs)
> Payout Target 20-25% of the global profits subject to local regulations
www.esselpropack.com
30
All figures as at 31st March of respective financial year All figures converted at March 18 closing USD/ INR rate @ 65.1750 March 2016, March 17 and March 2018 on IND AS basis earlier years on IGAAP basis
67 74 139 301 388 573 580 28 31 58 125 161 238 240 8.5 6.0 8.4 13.9 15.4 19.6 22.0
5 10 15 20 25 100 200 300 400 500 600 700 Mar-12 Mar-13 Mar-14 Mar-15 Mar-16 Mar-17 Mar-18 Market Cap (USD Mn) Market Price (Rs) P/E (TTM)
Market Cap / Market Price P/E (TTM)
www.esselpropack.com
> Increase the share of Non Oral Care Revenue to 50% > Revenue Growth @ 15% CAGR and PAT Growth @ 20% next 5 years > Improvement in Asset Turnover through Value growth resulting in improved EBIDTA margin, RoCE and RoE @ 20%. (MISSION 20:20:20)
31
www.esselpropack.com