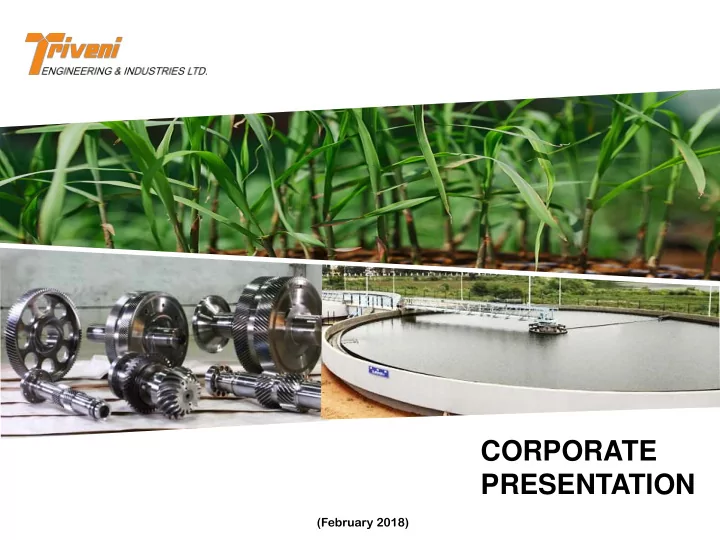
CORPORATE PRESENTATION (February 2018) Triveni Group Organisation - - PowerPoint PPT Presentation

corporate presentation
SMART_READER_LITE
LIVE PREVIEW

CORPORATE PRESENTATION (February 2018) Triveni Group Organisation - - PowerPoint PPT Presentation

CORPORATE PRESENTATION (February 2018) Triveni Group Organisation Structure Triveni Group Triveni Triveni Turbine Ltd. Engineering (TTL) & Industries TEIL holds 21.8% of the equity in TTL Ltd. (TEIL) 50% plus one share Co- Sugar


slide-1
SLIDE 1

CORPORATE PRESENTATION

(February 2018)

slide-2
SLIDE 2

Triveni Group Organisation Structure

2

Triveni Group

Triveni Engineering & Industries

  • Ltd. (TEIL)

Triveni Turbine Ltd. (TTL) Sugar Businesses Sugar Businesses Co- generation Business Distillery Business GE Triveni Ltd. (GETL) Engineering Businesses Gears Business Water Business Triveni Turbines Europe Pvt. Ltd. (TTEPL) Triveni Turbines DMCC (TTD)

TEIL holds 21.8% of the equity in TTL 50% plus

  • ne share
slide-3
SLIDE 3

Triveni Group Fact Sheet

3

Two Independent Listed Companies with total FY 17 gross revenue of INR 37.12 billion (USD 573 million) – Triveni Engineering & Industries Ltd. and Triveni Turbine Ltd. Listed in both National Stock Exchange & Bombay Stock Exchange Total Market Capitalisation of ~ INR 5.8 billion (~ USD 900 million) (as on February 16, 2018) Promoter driven, professionally managed companies with eminent and independent Board of Directors Triveni Engineering is one of the largest integrated sugar manufacturers in India and market leader in its engineering businesses comprising high speed gears, gearboxes, and water & waste water treatment solutions Triveni Turbine Ltd. is one of the world’s largest manufacturers

  • f steam turbines up to 30 MW range for providing industrial &

renewable power solutions 1 2 3 4 5

slide-4
SLIDE 4

4

Financial Performance – TEIL (Consolidated)

In ` million

Q3 FY 18 Q3 FY 17 % Change 9M FY 18 9M FY 17 % Change Gross Revenue 7726 7237 7% 26776 20294 32% EBITDA 968 1314

  • 26%

3990 3695 8% EBITDA Margin 13% 18% 15% 18% Share of income from Associates 33 75 106 195 Profit / (Loss) Before Tax 791 1020

  • 22%

3035 2540 20% Profit / (Loss) After Tax (PAT) Consolidated 601 764

  • 21%

2212 1925 15% Other Comprehensive Income (Net of Tax) 9 (3) 7 3 Total Comprehensive Income 610 761

  • 20%

2219 1928 15% EPS (not annualized) (`/share) 2.33 2.96 8.58 7.46

slide-5
SLIDE 5

5

Engineering Business

slide-6
SLIDE 6

Engineering Businesses

A leading player in the high technology water & wastewater management business

6

Market leader in High speed gears & gear boxes upto 70 MW capacity and speed of 70,000 rpm

Triveni Gears Triveni Water

slide-7
SLIDE 7

Engineering Businesses – Revenue Growth

500 1000 1500 2000 2500 3000 3500 4000

FY 12 FY 12-14* FY 15 FY 16 FY 17

2736 3951 3009 2524 2734 423 256 255 70 153

` in millions

Revenue PBIT Note: For FY 16 & FY 17 revenue figures are including excise duty FY 12-14* - 18 months period from Oct 12 – Mar 14

7

slide-8
SLIDE 8

Gears Business - Overview

8

 Design, manufacture and marketing of customised gears and gearboxes (both high speed and niche low speed gears)  State-of-the-art design and manufacturing facility at Mysore conforming to international standards  Triveni technology for high speed gear boxes upto 7.5 MW and for hydel gearbox range upto 6 MW  Range above 7.5 MW-62 MW is manufactured using technology licensed from GE (Lufkin), USA

slide-9
SLIDE 9

9

Fully integrated plant with all critical operations in-house with state-of-the-art infrastructure Preferred partner to Domestic and Multinational OEMs Benchmarked to global quality practices and 5S More than 21,500 MW and 8000 gearboxes in

  • peration

Leading Turbo Gears company in India and SE Asia, market share of >80% in High Speed Segment Strong presence in Replacement market

Gears Business - Overview

slide-10
SLIDE 10

 While the turnover for the quarter and nine months

ended Dec 2017 went up by 43% and 30% respectively, the PBIT increase has been substantial at 210% for the quarter and 118% for the nine months

 Order booking also improved by 152% in 9M FY 18  Overall the market looks stable with positive signs

from some sectors

 The business has strong enquiries from defence and

is hopeful of concluding some more of them in the coming quarters

Gears Business – Financial Performance

1043 1421 1033 1199 922 301 397 292 292 180 200 400 600 800 1000 1200 1400 1600

FY 12 FY 12-14* FY 15 FY 16# FY 17#

` in millions

Net Sales PBIT

Outstanding Order Book as on 31st Dec 2017 – ` 1.38 billion (including ` 508 million long term order)

10

#revenue figures are including excise duty FY 12-14* - 18 months period from Oct 12 – Mar 14

slide-11
SLIDE 11

Water Business - Overview

11

 Technology association with world’s leading technology providers for various products, process & solutions such as Ultra filtration (UF), Reverse Osmosis (RO), Moving Bed Bio Reactor (MBBR) etc.  Over 2000 numbers of process equipments for water & waste water treatment applications, supplied and commissioned till date  During FY 12, the Company has made a long term strategic investment by acquiring 25.04% equity stake in an International Water Technology Company, engaged in providing water treatment solutions using proprietary technology

slide-12
SLIDE 12

12

Technology associations with the world’s leading technology providers for various products, processes and solutions

  • Approx. 8000 MLD of

water is treated through

  • ur projects & equipment

Over 100 successfully

  • perating installations

across various segments – infrastructure, industrial and municipal Won many Water Awards for Innovative project designs

Water Business - Overview

slide-13
SLIDE 13

Water Business – Financial Performance

1692 2530 1976 1326 1812 123

  • 141
  • 37
  • 221
  • 28
  • 500

500 1000 1500 2000 2500 3000

FY 12 FY 12-14 (*) FY 15 FY 16# FY 17#

` in millions Net Sales PBIT

 Slow progress and delay in completion of certain

projects are resulting in cost escalations which have adversely impacted the results

 The total order intake for 9M FY 18 was ` 839 million  The Company has participated in various tenders and

some of such enquiries are in advance stages of finalization

 The Company has participated in large number of

tenders which are in various stages of finalisation. The Company is expecting significant order booking in FY 18 which will ensure growth in turnover in the coming years Outstanding Order Book as on 31st Dec 2017 – ` 6.02 billion

(including ` 2.54 billion towards O&M)

13

#revenue figures are including excise duty FY 12-14* - 18 months period from Oct 12 – Mar 14

slide-14
SLIDE 14

14

Sugar Business

slide-15
SLIDE 15

15

Sugar Business

One of the largest sugar producers in India with seven sugar manufacturing facilities Three grid connected co-generation plants and three incidental co-generation plants located across five sugar units. One of the largest single stream molasses based distillery in the country located at Muzaffarnagar

Sugar Co-generation Distillery

slide-16
SLIDE 16

 As against original all India sugar production estimates of around 25 million tonnes, the estimates have been revised upwards to about 27.5 million tonnes with bulk of the production coming from Uttar Pradesh at about 10.5 million tonnes and Maharashtra at about 9.5 million tonnes.  In view of supply pressure to pay cane dues and estimates of higher production estimates, the sugar prices have fallen by about ` 5 per kg and risen shortly recently.  The Government had been pragmatic in comprehending the grave situation and the problems

  • f resultant cane dues. It has initiated series of

actions which have reversed the trend of decline in prices including withdrawal of stock holding limit on traders and increasing the import duty to 100%. However, the export is the only sustainable solution to liquidate the surplus stocks.  The Central Government has also announced stock limit on sales of sugar by mills under which each sugar mill will have to keep with at the end of February 2018 not less than 83% of the closing stock as on January 31 in addition to the February sugar production less sugar exported during the month and for February 2018, 86% of the closing stock as of February 2018 in addition to March sugar production less sugar exports for March 2018. This should help in maintaining the demand-supply balance in the market thus improving sugar prices and helping in timely payment of sugarcane prices to farmers.  FRP declared at ` 255 per quintal at 9.5% recovery; SAP declared at ` 315 per quintal for general variety  The Central Government has raised the ethanol price by around 5% from ` 39/ltr to ` 40.85 per ltr for Marketing Year 2017-18 starting from December 2017 for a total quantity of 313 crore litres, an increased quantity of ~12% over last year.

Sugar Business – Industry Overview

16

slide-17
SLIDE 17

 The global sugar surplus is estimated at a further 3.9 million tonnes in 2017/18. The global sugar prices have been under pressure and at the end

  • f Jan 2018 reached levels of 13.23 Cents/Pound

for raw sugar and 352.40 US$/MT.  The sugar production for the 2017-18 harvest is substantially complete in Brazil. The sugar produced by Brazil CS region mills till Jan 16, 2018 is 35,827 thousand tonnes which is 1.67% higher than the corresponding period of previous

  • year. The share of sugarcane towards production
  • f sugar has increased to 46.92% in 2017/18 as

compared to 46.60% in 2016/2017.  In Thailand, the sugar production is estimated at ~ 12 million tonnes in 2017/18 owing to improved sugar extraction rate. The total cane crushing reached 20.1 million tonnes producing sugar at 1.6 million tonnes by the end of December 2017 as compared to 0.931 million tonnes produced in the corresponding period of previous year

Sugar Business – Industry Overview

17

International Sugar Scenario

slide-18
SLIDE 18

Sugar Business – Industry Overview

(Figures in million tonnes)

  • Source: Industry data; SS 17-18- Company Estimates
  • Closing stock taken as a percent of off-take is one of the indicators of sugar price movement.

2012-13 2013-14 2014-15 2015-16 2016-17 (P) 2017-18 (E) Opening Stock as on 1st Oct. 6.6 9.3 7.5 9.1 7.75 3.9 Production during the Season 25.1 24.4 28.3 25.1 20.3 27.5 Imports 0.7 0.1 0.0 0.0 0.5 0.3 Total Availability 32.4 33.8 35.8 34.2 28.55 31.7 Off-take I) Internal Consumption 22.7 24.2 25.6 24.9 24.6 25.5 ii) Exports 0.3 2.1 1.1 1.6 0.05 0.0 Total off-take 23.1 26.3 26.7 26.5 24.65 25.5 Closing Stock as on 30th Sept. 9.2 7.5 9.1 7.7* 3.9 6.2 Stock as % of Off-take 39.8% 28.5% 34.0% 28.1% 15.8% 24.3%

18

slide-19
SLIDE 19

Sugar Business - Overview

19

 Major facilities located in cane rich areas of Western Uttar Pradesh with more than 80% cane intensity – fertile and irrigated land  Sugar cane catchment area for all sugar units under canal irrigation – both in Western & Central Uttar Pradesh - Lower dependency on monsoon  Closer to country’s major sugar consuming markets

  • better realizations & lower transportation cost.

Long term relationship with ~ 250,000 farmers  Extensive sugar cane development programme – to develop new areas under cane cultivation in our new locations; improving yields of cane across the units.

slide-20
SLIDE 20

Sugar Business – Financial Performance

 The sugar stocks have been written down to net

realizable value as at the end of the quarter and the total inventory write down of ` 247 million has been

  • considered. The cost of production during the initial

period of season up to 31.12.2017 is transitory and is expected to substantial decline due to better recoveries and scale of operations.

 The sugar inventory as on Dec 31, 2017 was 20.8 lac

quintals valued at ` 32.8/Kg.

 The sugarcane crushing in all our sugar units is in

line with our expectations.

 The cane crushing up to 13th Feb 2018 has

increased by 19% y-o-y with an increase in sugar production by 22% at an increase in recovery by 28 basis points.

 Income from Incidental co-generation units at

Chandanpur, Milak Narayanpur and Sabitgarh resulted in a revenue of ` 80.6 million for the quarter ended Dec 2017. FY 11 FY 12 FY 12-14 (*) FY 15 FY 16# FY 17# Net Sales (` in millions) 13434 14821 24930 16284 16405 26108 PBIT (` in millions) 74 29 (1919) (1659) (282) 3649 Sugar Manufactured (000 t) 420 465 937 491 488.5 707.6

20

#revenue figures are including excise duty FY 12-14* - 18 months period from Oct 12 – Mar 14

slide-21
SLIDE 21

Co-generation Business - Overview

 Triveni presently operates grid connected three co- generation plants and three incidental co-generation plants located across five sugar units which facilitate export of surplus power to Uttar Pradesh Power Corporation Limited (UPPCL).  Deoband and Khatauli co-generation plants of the Company are registered as Clean Development Mechanism (CDM) projects with United Nations Framework Convention on Climate Change (UNFCCC) and have been registered with National Load Dispatch Centre (NLDC) as REC projects.

21

slide-22
SLIDE 22

Co-generation Business – Financial Performance

 The operating days of co-generation units during the Q3 FY 18 were higher compared to the corresponding period of last year due to early start

  • f the crushing season leading to higher turnover.

 The operating efficiency of the plants continued to be excellent.  Income of ` 52 million has been realised during the current quarter and ` 64 million during nine months from the sale of Renewable Energy Certificates (RECs) in respect of Khatauli and Deoband units

1293 2657 1568 1706 1826 499 994 658 780 694 500 1000 1500 2000 2500 3000 FY 12 FY 12-14 (*) FY 15 FY 16# FY 17#

` in millions

Net Sales PBIT

22

#revenue figures are including excise duty FY 12-14* - 18 months period from Oct 12 – Mar 14

slide-23
SLIDE 23

Distillery Business - Overview

 One of the largest single stream molasses based distillery in the country located at Muzaffarnagar.  Strategically located in close proximity to two of its largest sugar units - Khatauli and Deoband, the distillery procures consistent supply of captive raw material.  The distillery has a flexible manufacturing process allowing it to produce Extra Neutral Alcohol (ENA), Rectified Spirit (RS), Special Denatured Spirit (SDS) & Ethanol which are renowned for their high quality.

23

slide-24
SLIDE 24

1264 2261 1525 1805 1680 272 737 287 437 466 500 1000 1500 2000 2500

FY 12 FY 12-14 (*) FY 15 FY 16# FY 17#

` in millions Net Sales PBIT

Distillery Business – Financial Performance

 The distillery remained closed for over a month in first half of FY 18 which has impacted the overall production of the distillery.  The ethanol tender for Dec 2017- Nov 18 was delayed and due to which the supplies during the quarter had affected, which resulted in lower sales volume.  The Company received 2.72 cr ltr of contract for ethanol supply during 2017-18 (Dec 17- Nov 18) at an administered basic price of ` 40.85 /litre.  The share of Ethanol sales in 9M FY 18 is 92% of the total sales volume, as against 73% in 9M FY 17.

24

#revenue figures are including excise duty FY 12-14* - 18 months period from Oct 12 – Mar 14

slide-25
SLIDE 25

25

Triveni Turbine Ltd.

slide-26
SLIDE 26

26

Triveni Turbines Factsheet

One of the world’s largest manufacturers of steam turbines up to 30 MW range for providing industrial & renewable power solutions Market leadership position in India, with around 60% market share for a decade Joint Venture with General Electric (now BHGE), GE Triveni Ltd, with majority stake for the range above 30 MW to 100 MW

slide-27
SLIDE 27

27

Triveni Turbines Factsheet

Over 3000 steam turbines installed globally Presence in

  • ver 70

countries Over 12 GW power generation capacity

slide-28
SLIDE 28

28

Global Footprint

CAGR of 25% in Export sales in past 5 years

VIETNAM TRIVENI TURBINES EUROPE PVT LTD SOUTH AFRICA INDONESIA TRIVENI TURBINES DMCC LTD. International Service Locations Subsidiaries Head Office/ Manufacturing TRIVENI TURBINE LTD, INDIA 13 SERVICE CENTERS THAILAND

c v

slide-29
SLIDE 29

29

Infrastructure

State-of-the-art manufacturing facilities equipped to provide manufacturing of critical components, assembly, testing and refurbishing services 1 Latest design tools and software to deliver innovative solutions to customers 2

slide-30
SLIDE 30

30

Strong design team supported by consultants and domain experts Association with globally acclaimed turbo-machinery design houses Innovative designs delivering maximum performance and higher efficiency Continuous value engineering helps us to deliver products designed to meet customers’ requirements for economic installation and operation

Design & Development

TTL has filed total 201 IP filings till Mar 31, 2017 Innovative product development concepts such as design to cost, QFD, FMEA techniques, DOE Deploy Latest computer aided design and engineering software for continuous product development The R & D advanced product program has commercialized over 50 models/ variants The Company won the prestigious National Intellectual Property Award 2016 for "Top Organisation in Design"

slide-31
SLIDE 31

Customised Service Solutions Highly Skilled Team OEM Expertise Latest Equipment Total Customer Satisfaction High Repeat Customers Orders

31

Comprehensive Service Solutions

Service Offerings:

  • Full speed vacuum balancing tunnel for balancing

turbines, compressors/alternators

  • Customization & upgradation of old turbines for both

industrial and utility segments

  • Refurbishment solutions for higher MW turbines, upto 300

MW for all makes

  • Overhauling & Troubleshooting; quick response in the

delivery of spares

slide-32
SLIDE 32

6569 5083 6255 7129 7446 1567 1014 1356 1670 1846 23.8 20.0 21.7 23.4 24.8 5 10 15 20 25 30 1000 2000 3000 4000 5000 6000 7000 8000 FY13 FY14 FY15 FY16 FY17 (%) ` in millions Net Sales PBT PBT Margins (%)

32

Financial Performance

Note: For FY 16 & FY 17 consolidated numbers including Share of Profit from JV have been considered For FY 13 – FY 15 standalone figures have been considered

slide-33
SLIDE 33

33

Q3/9M FY 18 Financial Performance (Consolidated)

(Figures in ` million)

Q3 FY 18 Q3 FY 17 % Change 9M FY 18 9M FY 17 % Change TOTAL income 1676 2030

  • 17%

5116 5808

  • 12%

EBITDA 352 574

  • 39%

1030 1483

  • 31%

EBITDA Margin 21% 28% 20% 26% Depreciation & Amortisation 47 37 27% 138 106 30% PBIT 305 537

  • 43%

892 1377

  • 35%

PBIT Margin 18% 26% 17% 24% Finance Cost 3 2 5 2 PBT 302 536

  • 44%

887 1375

  • 35%

PBT Margin 18% 26% 17% 24% Share of Profit of JV

  • 23

1 8 43 Consolidated PAT 194 358

  • 46%

606 969

  • 37%

Consolidated PAT Margin 12% 18% 12% 17% EPS (`/share) 0.59 1.08 1.84 2.93

slide-34
SLIDE 34

34

GE Triveni Ltd.

 Triveni Turbine Ltd. formed a 50:50 Joint Venture with a GE affiliate on 15th April 2010. GE Triveni Ltd. (GETL) headquartered in Bengaluru, a subsidiary of TTL, designs, supply, sell and service advanced technology steam turbines in India in the range above 30-100 MW for power generation applications in India and globally  GETL gets technology and on-going R&D support from GE and TTL and use TTL’s Bengaluru facility for turbine manufacturing  GETL recorded sales of ` 935 million with a PAT of ` 16.6 million during 9M FY 18  Even though the JV did not close any orders during the quarter, the enquiry pipeline is strong enough indicating good order finalization in the coming quarters.  The execution and commissioning of large sized turbines in the export market is underway and GETL expects these references to help it to achieve enhanced order inflows in the future

slide-35
SLIDE 35

Contact for Investor Relations

CN Narayanan Triveni Engineering & Industries Ltd.

  • Tel. +91 120 430 8000 Fax : +91 120 431 1010

cnnarayanan@trivenigroup.com Gavin Desa/ Rabindra Basu Citigate Dewe Rogerson Tel: +91 22 66451237/1248 gavin@cdr-india.com / rabindra@cdr-india.com

  • DISCLAIMER :

Some of the statements in this presentation that are not historical facts are forward looking statements. These forward-looking statements include our financial and growth projections as well as statements concerning our plans, strategies, intentions and beliefs concerning our business and the markets in which we operate. These statements are based on information currently available to us, and we assume no obligation to update these statements as circumstances change. There are risks and uncertainties that could cause actual events to differ materially from these forward- looking statements. These risks include, but are not limited to, the level of market demand for our services, the highly-competitive market for the types of services that we offer, market conditions that could cause our customers to reduce their spending for our services, our ability to create, acquire and build new businesses and to grow our existing businesses, our ability to attract and retain qualified personnel, currency fluctuations and market conditions in India and elsewhere around the world, and other risks not specifically mentioned herein but those that are common to industry. Further, this presentation may make references to reports and publications available in the public domain. Triveni Engineering & Industries Ltd. makes no representation as to their accuracy or that the company subscribes to those views / findings. 35