
SLIDE 1
Corporate Presentation May 2018 Disclaimer This presentation and - - PowerPoint PPT Presentation
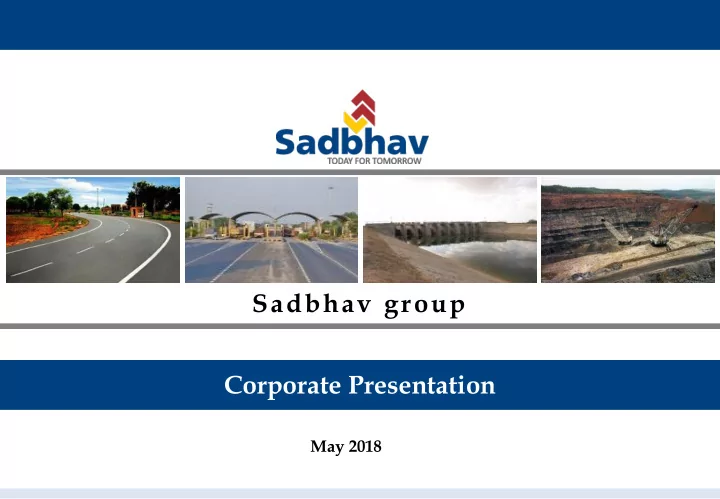
Sadbhav group Corporate Presentation May 2018 Disclaimer This presentation and the accompanying slides (the Presentation), which have been prepared by Sadbhav Group (the Company), have been prepared solely for information purposes and
This presentation and the accompanying slides (the “Presentation”),which have been prepared by Sadbhav Group (the “Company”), have been prepared solely for information purposes and do not constitute any offer, recommendation or invitation to purchase or subscribe for any securities, and shall not form the basis or be relied on in connection with any contract or binding commitment whatsoever. No offering of securities of the Company will be made except by means of a statutory offering document containing detailed information about the Company. This Presentation has been prepared by the Company based on information and data which the Company considers reliable, but the Company makes no representation or warranty, express or implied, whatsoever, and no reliance shall be placed on, the truth, accuracy, completeness, fairness and reasonableness of the contents of this Presentation. This Presentation may not be all inclusive and may not contain all of the information that you may consider material. Any liability in respect of the contents of, or any omission from, this Presentation is expressly excluded. Certain matters discussed in this Presentation may contain statements regarding the Company’s market opportunity and business prospects that are individually and collectively forward – looking statements. Such forward-looking statements are not guarantees of future performance and are subject to known and unknown risks, uncertainties and assumptions that are difficult to predict. These risks and uncertainties include, but are not limited to, the performance
company’s ability to successfully implement its strategy, the Company’s future level so growth and expansion, technological implementation, changes and advancements, changes in revenue, income or cashflows, the Company’s market preferences and its exposure to market risks, as well as other risks. The Company’s factual results, level so activity, performance or achievements could differ materially and adversely from results expressed in or implied by this Presentation.
3
EPC Business Sadbhav Infrastructure Project Limited (SIPL)
68.82%
5
Transport Irrigation Mining
BOT HAM Annuity
BOT Project Portfolio SIPL SEL J.V 1 Ahmedabad Ring Road Infrastructure Limited (ARRIL) 100.0% 0.0% 0.0% 2 Aurangabad Jalna Tollway Limited (AJTL) 100.0% 0.0% 0.0% 3 Nagpur Seoni Expressway Limited (NSEL) 100.0% 0.0% 0.0% 4 Hyderabad Yadgiri Tollway Private Limited (HYTPL) 100.0% 0.0% 0.0% 5 Bijapur-Hungund Tollway Private Limited (BHTPL) 77.0% 0.0% 23.0% 6 Rohtak Panipat Tollway Private Limited (RPTPL) 100.0% 0.0% 0.0% 7 Maharashtra Border Check Post Network Limited (MBCPNL) 1 77.5% 6.1% 16.4% 8 Dhule Palesner Tollway Limited (DPTL) 99.9% 0.1% 0.0% 9 Shreenathji-Udaipur Tollway Private Limited (SUTPL) 100.0% 0.0% 0.0% 10 Bhilwara Rajsamanad Tollway Private Limited (BRTPL) 100.0% 0.0% 0.0% 11 Rohtak Hisar Tollway Private Limited (RHTPL) 100.0% 0.0% 0.0% HAM Project Portfolio SIPL SEL J.V 1 Sadbhav Rudrapur Highway Private Limited (SRHPL) 100.0% 0.0% 0.0% 2 Sadbhav Nainital Highway Private Limited (SNHPL) 100.0% 0.0% 0.0% 3 Sadbhav Bhavnagar Highway Private Limited (SBHPL) 100.0% 0.0% 0.0% 4 Sadbhav Una Highway Private Limited (SUHPL) 100.0% 0.0% 0.0% 5 Sadbhav Bangalore Highway Private Limited (SBGHPL) 100.0% 0.0% 0.0% 6 Sadbhav Udaipur Highway Private Limited (SUDHPL) 100.0% 0.0% 0.0% 7 Sadbhav Vidarbha Highway Private Limited (SVDHPL) 100.0% 0.0% 0.0% 8 Sadbhav Jodhpur Ring Road Highway Private Ltd (SJRRHPL) 100.0% 0.0% 0.0% 9 Sadbhav Vishkapatnam Road Private Ltd (SVRPL) 100.0% 0.0% 0.0% 10 Sadbhav Bhimasar Bhuj Highway Private Ltd (SBBHPL) 100.0% 0.0% 0.0% 11 Sadbhav Tumkur Highway Private Ltd (STHPL) 100.0% 0.0% 0.0% 12 Sadbhav Kim Expressway Private Ltd (SKEPL) 100.0% 0.0% 0.0% 13 Mysore Bellary Highway Private Limited(MBHPL) 2 0.0% 74.0% 26.0% Under Construction Operational Under Development Note: 1. Share purchase agreement (SPA) has been signed for stake transfer of 10.0% stake from Srei group to SIPL. SPA has been signed for stake sale of 2.6% stake to D.Thakkar Construction Private Ltd or its associates 2. SPA has been signed for stake transfer of 74% stake from SEL to SIPL and 26% stake from GKC Projects to SIPL. MBHPL is the subsidiary of Sadbhav Engineering Limited Under the HAM portfolio.
7
Gross block of fixed assets as on 31st March 2018 stands at Rs. 7,305 mn
65,045 mn. Long-term facilities & NCDs are rated A+ by CARE and short-term facilities/CP are rated A1+ by CARE
30 months Order Book Rs 1,32,493 mn – March, 2018 Projects Completed Till Date Segment Size
Transport – Roads Over 7,551 lane kms Irrigation – Canal work Over 656 kms Mining Over 501 mn cubic mt Order book (incl L1) to sales ratio stands at 3.7 x FY18 revenue providing good revenue visibility
Key Clients
81% 3% 15% Transport Irrigation Mining
Only listed Road & Highways BOT company in India with a portfolio of 11 BOT projects and 12 Hybrid Annuity projects
(HAM) projects under development. Besides this, acquisition of stake in Mysore Bellary Highway Project Limited (MBHPL) from SEL & JV partner is under process. Financial closure have been achieved for 7 HAM projects and construction has begun for all 7 HAM projects
Total project costs for twelve HAM projects is INR 110,810 mn and equity invested (including subdebt) as on March 2018 is INR 2,689 mn. Eight out of eleven operational BOT projects and Seven out of twelve HAM projects have credit rating of A- or above.
collection and O&M capabilities.
28th May, 2018 the market capitalization of SIPL stood at INR 45,824 mn. Long-term facilities & NCDs are rated A+ (SO) by CARE
Geographically diversified portfolio1
Rs mn Project Costs based on 23 projects Toll Annuity Hybrid Annuity Total Operational 83,597 3,748
Partly Operational 14,800
Construction
110,810 Total 98,397 3,748 110,810 212,955
1 Based on Total Project Costs of 23 projects
8
22% 11% 16% 18% 21% 2% 4% 3% 3% Maharashtra Haryana Karnataka Rajasthan Gujarat Telangana
Strong Institutional Presence over the years..
Strong Institutional Presence
9
Shareholding Pattern as on 31st March 2018 Category
%
Promoter Group 79,734,880 46.47% Public Shareholding 91,835,920 53.53% Institutions 80,576,260 46.96%
38,340,230 22.35%
15,569,200 9.07%
26,666,830 15.54% Non-Institutions 11,259,660 6.56% Total Shareholding 171,570,800 100.00%
47.43% 47.25% 48.68% 47.11% 47.17% 46.76% 46.47% 41.05% 44.72% 45.98% 45.13% 46.53% 48.48% 46.96% 11.52% 8.03% 5.34% 7.76% 6.30% 4.76% 6.57% 0% 10% 20% 30% 40% 50% 60% 70% 80% 90% 100% 2012 2013 2014 2015 2016 2017 2018 Promoter Institution Non-Institution
10
Shareholding Pattern as on 31st March, 2018 Category
% holding Promoter Group 244,250,911 69.35% Public Shareholding 107,974,305 30.65% Institutions 60,473,628 17.17% DIIs 21,853,240 6.20% FIIs 38,620,388 10.96% Non-Institutions 47,500,677 13.49% Total 352,225,216 100.00% Strong Institutional Presence Top public shareholders as on 31st March, 2018
% holding Nomura Asset Management – Various schemes 29,955,228 8.50% Norwest Venture Partners 29,121,860 8.27% Reliance Capital Trustee – Various schemes 11,796,031 3.35% HDFC Trustee Company – Various schemes 7,810,326 2.22% HSBC Funds – Various schemes 4,976,083 1.41% TATA Mutual Fund – Various schemes 2,126,425 0.60% ICICI Prudential Life Insurance Company Ltd 1,619,801 0.46%
Net Revenue Rs 2,913 mn Net Profit Rs 139 mn Net worth Rs 1,254 mn Gross Block Rs 1,038 mn Order Book Rs 13,300 mn BOT Projects1 1 Under Construction 1 Total Project Cost Rs 8,060 mn Mkt Cap2
Rs 2,016 mn
Net Revenue Net Profit Net worth Gross Block Rs 12,569 mn Rs 538 mn Rs 3,915 mn Rs 3,322 mn Order Book Rs 67,686 mn BOT Projects Fully Operational Under Construction Total Project Cost Rs 48,430 mn 6 3 3 Mkt Cap Rs 15,850 mn
11 Note – Financials are on standalone basis 1.LoA date 2.On listing date 3.Including stake in MBHPL held by SEL. 4.As on 28th May, 2018
Net Revenue Net Profit Net worth Gross Block Rs 35,050 mn Rs 2,206 mn Rs 18,667 mn Rs 7,305 mn Order Book Rs 1,32,493mn Mkt Cap4 Rs 65,045 mn BOT/HAM Projects3 Fully Operational Partially Operational Under Construction Total Project Cost Rs 220,791 mn 24 11 1 12
CAGR 2006-18 Net Revenue ~ 23% Net Profit ~ 26% Order book ~ 21%
13
upgradation, widening & strengthening of roads & highways
lane kms of roads & highways
NH 15 (ADB funded) - 106 kms
Rajasthan – 183 kms
(76 kms), BHTPL (97 kms), DPTL (89 kms), EPE (46 kms) Order book
translates to 3.69x of FY18 Transport revenue
31, 2018 Major Projects Ongoing
Rs mn
Transport Order book over the years Key Clients
FY12 FY13 FY14 FY15 FY16 FY17 FY18 53,990 66,201 45,961 37,929 40,706 49,968 107,751
canals, syphon, remodeling & improvement of canals
canals
108 to 127 km for SSNNL
Watrak for SSNNL
earthwork, structures, lining and service road to Kachchh Branch Canal
14
Order book
translates to 1.40x of FY18 Irrigation revenue Major Projects Ongoing
Rs mn
Irrigation Order book over the years Key Clients
FY12 FY13 FY14 FY15 FY16 FY17 FY18 11594 15004 19397 20146 14419 9899 4538
mining of minerals
cubic meters
Khadia OCP
material at Junad OCM of Wani area
GIPCL for excavation of
at Mangrol mines
Order book
translates to 7.87x of FY18 Mining revenue Major Projects Ongoing
Rs mn
15
Mining Order book over the years Key Clients
FY12 FY13 FY14 FY15 FY16 FY17 FY18 9958 20222 24049 23925 19748 16966 20203
16
(Rs mn)
2.8x 5.6x 3.8x 2.8x Order Book to Sales Ratio Gross Block 2.4x 2.3x 3.7x 75,542.00 101,426.00 89,407.00 82,000.00 74,873.00 76,834.00 134,293.00
40,000.00 60,000.00 80,000.00 100,000.00 120,000.00 140,000.00 160,000.00 FY12 FY13 FY14 FY15 FY16 FY17 FY18
74% 65% 46% 55% 65% 81% 13% 20% 29% 26% 22% 15% 14% 15% 25% 19% 13% 3%
FY11 FY13 FY15 FY16 FY17 FY18
Irrigation Mining Transport 3,715.2 5,173.8 8,511.9 6,731.5 6,758.5 7,305.5 61% 39% Capitve Non captive
(CFO & Whole time Director)
(Chairman Emeritus)
(Chairman and Managing Director)
(President - Finance)
(Whole time Director)
(Whole time Director)
(President - HR)
(GM - BD)
(Company Secretary)
17
(Technical Director - Irrigation)
(Whole time Director)
(CEO - Mining)
18
States – Rs mn Transport – BOT Transport – EPC Transport – HAM Irrigation Mining Total Rajasthan
13,673.72 Gujarat
34,656.31
Maharashtra 540.18
16,351.70 Jharkhand
8,235.01 Karnataka
15,386.60
Uttar Pradesh
8,921.99
Madhya Pradesh
32.30 3,432.14 Andhra Pradesh 14.32 95.36 4,210.00 771.90
Orrisa
Haryana 102.43 3,242.45
Punjab
Delhi
Chattisgarh
Total 656.94 26,370.24 80,723.92 4,538.70 20,203.55 132,493.35
Financial year – Rs. crs. 2018 2017 2016 2015 2014 2013 2012 2011 2010 2009 2008 2007 2006 Total income 3,505 3,320 3,186 2,970 2,358 1,872 2,686 2,229 1,274 1,074 905 485 284 % growth 5.56 4.2 7.3 26.0 26.0 (30.3) 20.5 75.0 18.6 18.7 86.6 70.8 EBITDA 415 356 315 300 249 217 290 226 138 108 102 59 35 % growth 16.74 13.0 5.0 20.5 14.7 (25.2) 28.3 63.8 27.8 5.9 72.9 68.6 EBITDA (%) 11.8 10.7 9.9 10.1 10.6 11.6 10.8 10.1 10.8 10.1 11.3 12.2 12.3 PBT 216 190 165 146 82 111 209 176 98 83 77 39 31 PAT 221 186 133 114 106 74 141 120 54 63 52 26 14 EPS 12.86 10.95 7.70 7.25 7.01 4.91 9.36 8.50 4.21 5.06 4.34 2.42 1.67 BPS 108.81 96.81 86.82 79.94 63.12 55.15 50.74 41.75 31.32 27.41 22.75 13.22 11.19 Networth 1,866 1,661 1,489 1,371 957 833 762 626 392 343 284 144 122 Equity in subs 571 565 559 527 443 460 325 324 144 110 110 46 10 Net networth 1,295 1,096 930 844 514 373 437 302 248 233 174 98 112 Total debt 1,499 1,780 1,228 1,114 1,028 765 460 396 424 211 150 73 52 Loan to subs 653 538 583 544 426 79 23 4 142 7 20
846 1,242 645 570 602 686 437 392 282 204 130 73 52 Debt/Equity 0.80 1.07 0.82 0.81 1.07 0.92 0.60 0.63 1.08 0.62 0.53 0.51 0.43 RoE (%) 18.48 18.36 14.99 16.79 23.90 18.27 38.16 43.64 22.45 30.96 38.24 24.76
19
Synopsis Portfolio of 18 Roads & Highways BOT projects of which 10 projects are fully operational and 12 HAM projects are under development/under construction
As on March 31, 2018
Toll Annuity HAM NHAI State Operational 10 1 8 3 Partly Operational Under construction/develop 12 8 Total 10 1 12 16 3
1 Weighted average w.r.t. total project cost
21
Standalone Financials - SIPL Consolidated Financials - SIPL
Particulars (Rs mn) FY18 FY17 FY16 FY15 FY14 Revenue 3,377.9 2,854.4 858.0 701.1 911.8 Other income 469.6 282.6 405.6 372.0 246.6 Total Income 3,847.5 3,137.1 1,263.6 1,073.1 1,158.4 Interest 1,634.2 1,295.0 1,400.0 1,037.5 526.8 PAT 677.40 411.6 (50.35) (632.7) 6.1 Networth 14,019.5 13,427.3 12,963.6 8,435.9 8,318.6 Total Debt 12,376.5 12,654.4 10,826.7 12,579.1 6,713.1 Particulars (Rs mn) FY18 FY17 FY16 FY15 FY14 Revenue 22,760.6 13,480.1 19,709.7 5,003.0 3,744.0 Other Income 464.2 558.8 387.5 285.9 215.9 Total Income 23,224.8 14,038.9 20,097.2 5,288.9 3,959.9 Interest 11,408.9 10,561.7 9,773.0 5,259.2 3,556.4 PAT (3,379.7) (3,601.0) (3,525.2) (3,450.5) (800.7) Networth (2,657.7) 716.5 4,554.4 7,809.1 8,548.5 Total Debt 84,073.6 80,938.1 78,679.1 62,038.8 49,017.3 As on March 31, 2018 Project Cost (Rs mn) Lane kms Residual life1 (Yrs/months) Equity invested (incl acquisitions) Toll 98,397 2,840 15 Y 8 M 21,108 Annuity 3,748 111 9 Y 5 M 435 Hybrid Annuity 110,810 2,553 17 Y 2 M 2,689 Total 212,955 5,504 16 Y 4 M 24,233
22
ARRIL
Indian ports uses ARRIL to connect to central and western India
Highways
use ring road instead
AJTL
Mumbai and Nagpur
freight intensive due to which three-fourth of the traffic is
BRTPL
BHTPL
located near Chennai. More than 90% traffic is commercial in nature
near future
DPTL
Chakan / Pune
highways in India provides connectivity between Mumbai to Delhi via Central India
HYTPL
Telangana
MBCPNL
project
RHTPL
Meham, Hansi, etc.
medium scale industries such as textiles, sugar among others
RPTPL
Maharashtra and Gujarat to the northern states
Chandigarh; also acts as a bypass to Delhi city
SUTPL
minor minerals is a key traffic growth driver
Project Details Terms Financials (INR mn)
23 Particulars ARRIL AJTL NSEL HYTPL Current Stake 99.99% 99.99% 99.99% 99.99% Project Type Toll Toll Annuity Toll State Gujarat Maharashtra Maharashtra/M.P. Telangana Client AUDA
NHAI NHAI Lane kms 305.4 263.2 110.9 142.6 Concession Start Dec-06 Feb-07 Nov-07 July-10 Original Concession (yrs) 20 Y 23 Y 6 M 20 Y 23 Y PCOD/COD May-08 Jul-09 May-10 Dec-12 Residual Life (Yrs/Months) 8 Y 6 M 12 Y 1 M 9 Y 5 M 15 Y 1 M Revenue Sharing Grant N.A. N.A. Premium Target Traffic (PCUs) N.A. N.A. N.A. 34,897 Target Date N.A. N.A. N.A. 01-Oct-19 Project Cost 5,435.1 2,724.0 3,747.9 4,947.1 Total Equity + Subdebt of SIPL 521.4 830.0 598.3 1,470.9 Debt Outstanding (31.03.2018) 2,584.1 2,199.6 1,750.0 3,745.1 Credit rating CARE A+ CARE A CARE AAA & IND AAA CARE A-
Project Details Terms Financials (INR mn)
24 Particulars BHTPL RPTPL MBCPNL DPTL Current Stake 76.99% 99.99% 83.60%1 99.99% Project Type Toll Toll Service Fee Toll State Karnataka Haryana Maharashtra Maharashtra JV Partner Monte Carlo Limited N.A SREI Infra, SREI Sahaj e- village Limited, DTCPL N.A Client NHAI NHAI
NHAI Lane km 388.8 323.4 22 Border CPs 355.2 Concession Start Sep-10 April-11
Dec-09 Original Concession (yrs) 20 Y 25 Y 24 Y 6 M 18 Y PCOD/COD April-12 Jan-14
Jan-12 Residual Life (Yrs/Months) 12 Y 3 M 17 Y 10 M 15 Y 8 M 9 Y 6 M Revenue Sharing Grant Premium Upfront Premium Premium Target Traffic (PCUs) 39,338 23,800 N.A 37,000 Target Date 01-Oct-20 01-Sep-19 N.A 01-Oct-20 Project Cost 13,688.7 11,610.2 14,800.82 14,200.0 Total Equity + Subdebt of SIPL 1,621.3 2,426.8 4,136.3 3,955.0 Debt Outstanding (31.03.2018) 8,048.2 7,557.2+ USD 37.78 mn 10,205.4 10,599.0 Credit rating CRISIL A CARE BB+ CARE A- CARE A
Private Ltd (DTCPL)
Project Details Terms Financials (INR mn)
25 Particulars SUTPL BRTPL RHTPL Current Stake 99.99% 99.99% 99.99% Project Type Toll Toll Toll State Rajasthan Rajasthan Haryana Client NHAI NHAI NHAI Lane kms 317.2 349.0 395.2 Concession Start Apr-13 Oct-13 Dec-13 Original Concession (yrs) 27 Y 30 Y 22 Y PCOD Oct-15 June-16 July-16 Residual Life (Yrs/Months) 21 Y 10 M 25 Y 4 M 17 Y 6 M Revenue Sharing Premium Grant Grant Target Traffic (PCUs) 24,281 16,209 27,726 Target Date 01-Apr-22 01-Oct-22 01-Oct-23 Project Cost 11,514.6 6,761.0 12,715.8 Total Equity + Subdebt of SIPL 3,114.6 1,333.0 1,100.8 Debt Outstanding (31.03.2018) 8,355.5 2,752.6 9,464.1 Credit rating CRISIL A (SO) CARE BBB CARE BB+
Project Details Terms Financials (INR mn)
26 Particulars SRHPL SNHPL SBHPL SUHPL SBGHPL Current Stake 99.99% 99.99% 99.99% 99.99% 99.99% Project Type (Pavement) HAM (Rigid) HAM (Rigid) HAM (Rigid) HAM (Rigid) HAM (Flexible) State Uttar Pradesh Uttrakhand Gujarat Gujarat Karnataka Client NHAI NHAI NHAI NHAI NHAI Lane kms 173.8 199.1 192.2 163.8 341.8 Concession Start Mar-17 Oct-17 Feb-17 Feb-17 Aug-17 Original Concession (yrs) 17 Y 17 Y 17 Y 6 M 17 Y 6 M 17 Y PCOD Mar-19 Oct-19 Aug-19 Aug-19 Aug-19 Total Project Cost 7,380.0 6,570.0 8,190.0 6,230.0 10,080.0 Total Equity + Subdebt of SIPL to be invested 885.6 788.4 982.8 747.6 1,209.6 Equity + Subdebt already infused upto 31.03.2018 289.0 458.0 357.7 231.1 608.8 Debt to be drawn down 3,542.4 3,153.6 3,931.2 2,990.4 4,838.4 Payment during construction from NHAI 2,952.0 2,628.0 3,276.0 2,492.0 4,032.0 SEL EPC value 6,030.0 5,250.0 6,500.0 4,950.0 8,550.0 SIPL EPC value 690.0 730.0 820.0 590.0 700.0 1st year O&M 75.6 90.0 105.0 84.5 315.0 Credit rating CRISIL A CARE A CRISIL A CARE A CARE A
Project Details Terms Financials (INR mn)
27 Particulars SUDHPL SVHPL Current Stake 99.99% 99.99% Project Type (Pavement) HAM (Rigid) HAM (Rigid) State Rajasthan Maharashtra Client NHAI NHAI Lane kms 143.3 267.5 Concession Start Nov-17 May-18 Original Concession (yrs) 17 Y 17 Y 6 M PCOD Nov-19 Nov-37 Total Project Cost 8,910.0 10,710.0 Total Equity + Subdebt of SIPL to be invested 1,076.0 1,290.0 Equity + Subdebt already infused upto 31.03.2018 430.4 314.0 Debt to be drawn down 4,270.0 5,140.0 Payment during construction from NHAI 3,564.0 4,280.0 SEL EPC value 7,450.0 8,300.0 SIPL EPC value 740.0 1,500.0 1st year O&M 30.0 66.6 Credit rating CARE A- CARE A
In addition to above, SJRRHPL, SVPRPL, SBBHPL, STHPL and SKEPL has signed the Concession Agreement and is in the process of achieving financial close
(Non-Independent & Non-Executive Director)
(Chairman Emeritus)
(Chairman & Non-Executive Director)
(CFO)
(President - Finance)
(CS & Compliance Officer)
(Managing Director)
(AGM - Accounts)
(Manager - Information Technology)
Executive Directors
(Vice President - O&M)
28
29
BOT (Toll) HAM No. Length (in km) Rs mn
No. Length (in km) Rs mn
Q4FY16
343 57,571 4.00 H1FY17 2 239 24,839 4 14 926 119,874 7.29 H2FY17 1 90 10,319 3 19 1,275 185,825 5.10 H1FY18
370 56,395 4.00 H2FY18
1,177 245,117 6.32 Total 3 329 35,158 3.67 68 4,091 664,783 5.74 BOT (Toll) HAM L1 L2 L3 >L4 L1 L2 L3 >L4 Q4FY16
3 1 2 H1FY17
3 4 2 5 H2FY17
9 2 6 H1FY18
1 2 H2FY18
6 6 5 Total
24 12 20 BOT (Toll) HAM Total No. Length (in km) Rs mn No. Length (in km) Rs mn No. Length (in km) Rs mn Upto 31st July, 2018 2 102 10,940 47 2,183 44,6040 49 2,285 456,980
* 7 bids are yet to open
30
Details related to cash profitability at SPVs (INR mn) Quarter FY17 Q1FY18 Q2FY18 Q3FY18 Q4FY18 FY18 Total Income from Operations + Other Income 10,128.60 2,619.44 2,561.97 2,768.30 2,776.74 10,726.45 Less: Recurring cash expenses (1,671.09) (400.10) (411.78) (421.79) (442.08) (1,675.75) Total Cash EBITDA 8,457.51 2,219.34 2,150.22 2,346.51 2,334.66 9,050.73 Cash EBITDA margin (%) 83.50% 84.73% 83.93% 84.76% 84.08% 84.38% Less: Recurring cash finance costs to lenders (7,359.31) (1,854.34) (1,750.16) (1,776.97) (1,701.67) (7,083.14) Less : Taxes 38.27 8.62 9.03 9.48 9.58 36.71 Cash profits after taxes at SPVs 1,136.47 373.62 409.09 579.02 642.57 2,004.30 Cash profits after taxes at SIPL standalone 780.69 113.23 261.14 292.60 127.77 794.74
Balance Sheet (Rs mn) FY18 FY17 FY16 FY15 Share Capital 171.5 171.5 171.5 171.5 Reserves & Surplus 18,496.3 16,437.3 14,720.5 13,349.1 Net Worth 18,667.9 16,608.9 14,892.0 13,520.6 Long Term Borrowings 2,862.8 3,062.3 4,932.1 5,582.9 Short Term Borrowings 10,463.2 12,121.0 5,696.5 3,799.9 Total Debt 13,326.0 15,183.3 10,628.6 9,382.8 DTL
Other Long Term Liabilities 83.1 98.0 31.9 337.1 Total Liabilities 32077.0 31,890.2 25,552.5 23,484.7 Gross Block 7,305.5 9,913.2 9,889.8 8,511.9 Less: Depreciation 2,277.8 4,684.4 3,959.3 3,154.7 Net Block 5,027.7 5,228.8 5,930.5 5,357.2 Non Current Investments 5,774.6 5,694.1 5,629.2 5,312.6 Net Current Assets 19,240.4 19,314.5 12,760.1 6,582.7 Cash and bank balances 126.5 229.6 165.5 351.1 Other Long Term Assets 1,907.8 1,423.3 1,067.2 5,881.1 Total Assets 32,077.0 31,890.2 25,552.5 23,484.7 Income Statement (Rs mn) FY18 FY17 FY16 FY15 Income from Operations 35,050.5 33,203.1 31,862.5 29,698.5 Expenditure 30,899.0 29,647.0 28,514.7 26,696.1 EBIDTA 4,151.5 3,556.1 3,347.9 3,002.4 %margin 11.84% 10.71% 10.51% 10.10% Depreciation 979.03 1,000.4 970.7 817.1 Finance Cost 1,167.2 992.0 855.0 890.9 Other Income 157.4 333.0 317.9 164.2 Exceptional items
2,162.6 1,896.8 1,645.6 1,458.5 Tax (51.1) 18.3 325.5 321.2 PAT 2,206.6 1,878.4 1,320.2 1,137.4 %margin 6.30% 5.66% 4.14% 3.80%
32
33 Balance Sheet (INR mn) FY18 FY17 FY16 FY15 Share Capital 3,522.3 3,522.3 3,522.3 3,109.6 Reserves & Surplus 10,497.2 9,905.0 9,441.3 5,326.3 Net Worth 14,019.5 13,427.3 12,963.6 8,435.9 Long Term Borrowings 6,795.3 8,110.8 5,290.3 7,331.6 Short Term Borrowings 5,581.7 4,543.5 5,536.4 4,887.5 Total Debt 12,377.0 12,654.3 10,826.7 12,219.1 Other Long Term Liabilities 844.6 654.2 322.7 0.8 Total Liabilities 27,241.1 26,735.8 24,113.0 20,655.8 Fixed Assets 1.8 8.4 0.5 12.8 Loans & Advances
Non Current Investments 24,232.7 22,565.2 21,336.6 4,143.6 Other Long Term Assets 50.3 147.4 129.0 482.4 Cash 13.6 35.7 46.0 36.1 Net Current Assets 2,942.7 3,979.1 2,600.9 2,452.5 Total Assets 27,241.1 26,735.8 24,113.0 20,655.8 Income Statement (INR mn) FY18 FY17 FY16 FY15 Income from Operations 3,377.92 2,854.4 858.0 701.1 Other Income 469.58 282.6 405.6 372.0 Total Income 3,847.50 3,137.1 1,263.6 1,073.1 Expenditure 2,801.4 2,611.2 1,928.0 1,684.2 Operating Expenses 1,063.64 1,185.1 326.5 493.6 Employee Benefit Expense 35.26 31.9 45.7 42.3 Other Expenses 64.17 92.3 94.5 109.5 Depreciation 4.12 6.9 0.7 1.3 Finance Cost 1,634.20 1,295.0 1,460.6 1,037.5 Exceptional Items
1,046.11 525.9 (48.5) (611.1) Tax 368.71 114.3 1.9 21.5 PAT 677.40 411.6 (50.3) (632.7)
1 Profit on transfer of rights in equity shares of MNEL
34 Balance Sheet (INR mn) FY18 FY17 FY16 FY15 Share Capital 3,522.3 3,522.3 3,522.3 3,109.6 Reserves & Surplus (6,179.9) (2,805.8) 1,032.1 4,699.5 Net Worth (2,657.7) 716.5 4,554.4 7,809.1 Minority Interest 106.1 262.3 (68.4) 569.6 Long Term Borrowings 78,379.7 76,359.8 73,039.7 57,061.8 Short Term Borrowings 5,693.9 4,578.2 5,639.4 4,977.0 Total Debt 84,433.6 80,938.0 78,679.1 62,038.8 Other Long Term Liabilities 17,980.7 16,403.5 14,064.7 23,326.4 Current Liabilities 16,156.3 6,101.3 5,142.7 5,136.2 Total Liabilities 115,658.9 104,421.6 102,372.5 98,880.3 Fixed Assets 206.31 223.0 235.3 219.7 Loans & Advances
Intangible assets 93,560.1 94,971.4 94,897.3 89,685.7 Non-current investments
Other Long Term Assets 4,346.9 5,107.8 4,790.3 1,868.1 Cash 558.4 503.9 871.7 1,695.6 Current Assets 16,987.14 3,615.4 1,577.8 1,745.0 Total Assets 115,658.9 104,421.6 102,372.5 98,880.3 Income Statement (INR mn) FY18 FY17 FY16 FY15 Income from Operations 22,760.6 13,480.1 19,709.7 5,003.0 Other Income 464.2 558.8 387.5 285.9 Total Revenue 23,224.8 14,038.9 20,097.2 5,288.9 Expenditure 26,197.2 17,563.8 24,345.1 8,834.6 Construction cost 8,920.3 1,596.3 10,749.6
2,389.4 2,270.6 1,643.7 1,635.5 Employee Expenses 483.3 414.8 308.8 243.0 Other Expenses 390.1 509.5 514.5 283.9 Depreciation 2,605.1 2,210.9 1,355.5 1,417.8 Finance Cost 11,408.9 10,561.7 9,773.0 5,259.2 Exceptional Items
116.5 PBT (2,972.2) (3,524.9) (3,631.9) (3,433.9) Tax 407.5 76.0 (106.7) 21.6 PAT (3,379.7) (3,601.0) (3,525.2) (3,455.5)
NAME OF MACHINERY OEM Quantity
Bachoe Loader CAT, JCB 9 Batching Plant(H,L,M) SCHWING STETTER 45 Bitumen Sprayer Apollo 17 Cement Feed Blower, Concerte Pumps, MIX planSchwing Stetter, Greaves 49 Canal Paver Diamond Equipment 6 Pick & Carry Crane, Tower Crane ACE, Escorts, CAT 6 Cement Silo Schwing stetter 59 Transit Mixer Schwing stetter 31 DLC PLANT Plus Equipment 7 Dumper TATA, Scania, AMW, Bharatbenz,Ashok Leyland 590 Drill Rig Mining Leeboy 18 Diesel Browser TATA 26 Dozer Mining JCB, CAT 33 Excavator JCB ,CAT, VOLVO, KOMATSU, HYUNDAI 76 Grader CAT, VOLVO ,Greaves 44 Hot Mix Batch Plant Schwing stetter 10 Loader JCB, CAT 24 Crusher Plant Terex, Metso,Local 11 WMM Plant Apollo, Maxmech ,Macoons 8 Paver Fin./DBM Paver Volvo, Writgen 16 Kerb Paving Machine Apollo 15 WMM Paver Volvo, Writgen 13 SoiL Compactor greaves, volvo, Writgen 56 Tandem Roller Volvo, Writgen 28 Slipform Paver Wtrigen 8 Water Chilling Plant Schwing stetter 5 Water Tanker Tata, volvo, L&T 47 Passenger Vehicle Toyota, Volvo, BMW, Balero, TATA 66 Other Supporting machinery CAT, Kirloskar, Cummins Etc 542