
SLIDE 1
Corporate Presentation June 2017 Manitok Energy Inc. is a public - - PowerPoint PPT Presentation
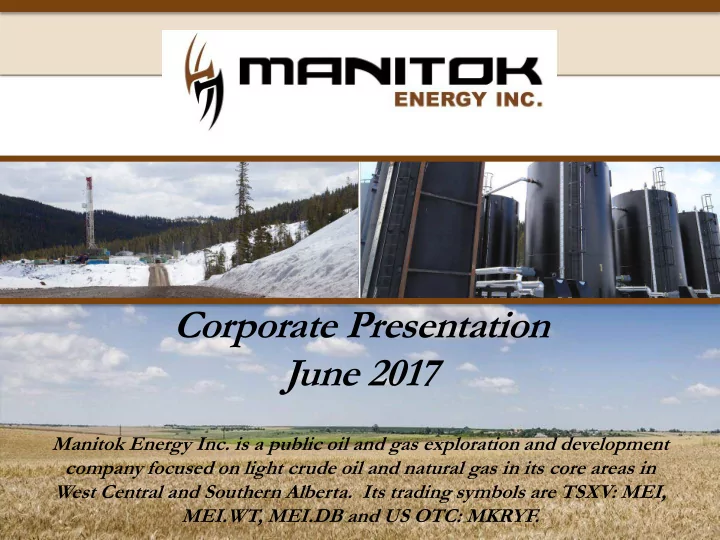
Corporate Presentation June 2017 Manitok Energy Inc. is a public oil and gas exploration and development company focused on light crude oil and natural gas in its core areas in West Central and Southern Alberta. Its trading symbols are TSXV:
Forward-looking Statements Certain statements contained in this presentation may constitute forward-looking information and statements. All statements in this presentation, other than statements of historical fact, that address events or developments concerning Manitok Exploration Inc. ("Manitok") that Manitok expects to occur are "forward-looking information and statements". Forward- looking information and statements are often, but not always, identified by the use of words such as "seek", "anticipate", "plan", "continue", "estimate", "expect", "may", "will", "project", "predict", "propose", "potential", "targeting", "intend", "could", "might", "should", "believe", "budgeted", "scheduled“ and "forecasts", and similar expressions and variations (including negative variations). In particular, but without limiting the foregoing, this presentation contains forward-looking information and statements pertaining to the following: future oil, NGLs and gas production and cash flows; additions of future oil and gas reserves and future recovery factors; future drilling plans, locations and inventory and future seismic activity; predictability, stability and reliability of future oil and gas production; future exploration and development opportunities; future netbacks and capital expenditures; mergers and acquisitions; future debt reduction; the volumes and estimated value of Manitok's oil and gas reserves; future results from operations and operating metrics; and future costs and expenses. Forward-looking information and statements are necessarily based on estimates and assumptions that are inherently subject to known and unknown risks, uncertainties and
information and statements. In preparing this presentation, estimates and assumptions have been made relating to, among other things: prevailing commodity prices and exchange rates; applicable royalty rates and tax laws; future well production rates; the performance of existing wells; the success of drilling new wells; the availability of capital to undertake planned activities; and the availability and cost of labour and services. Many of these estimates and assumptions are based on factors and events that are not within the control of Manitok and there is no assurance they will prove to be correct. Risk factors that could cause actual results to differ materially from those anticipated in these forward-looking information and statements include: the volatility of natural gas and oil prices; the limitations that Manitok's level of indebtedness may have on Manitok's financial flexibility; declines in the values of Manitok's natural gas and oil properties resulting in ceiling test write-downs; the availability of capital on an economic basis, including through planned asset monetization transactions, to fund reserve replacement costs; Manitok's ability to replace reserves and sustain production; uncertainties inherent in estimating quantities of natural gas and oil reserves and projecting future rates of production and the amount and timing of development expenditures; exploration and development drilling that does not result in commercially productive reserves; expiration of natural gas and oil leases that are not held by production; hedging activities resulting in lower prices realized on natural gas and oil sales and the need to secure hedging liabilities; uncertainties in evaluating natural gas and oil reserves of acquired properties and potential liabilities; the negative impact lower natural gas and oil prices could have on Manitok's ability to borrow; drilling and operating risks, including potential environmental liabilities; transportation capacity constraints and interruptions that could adversely affect Manitok's cash flow; potential increased operating costs resulting from legislative and regulatory changes such as those proposed with respect to commodity derivatives trading, natural gas and oil tax incentives and deductions, hydraulic fracturing and climate change; and losses possible from pending or future litigation. Manitok's production forecasts are dependent upon many assumptions, including estimates of production decline rates from existing wells and the outcome of future drilling activity. Although Manitok believe the expectations and forecasts reflected in these and other forward-looking information and statements are reasonable, Manitok can give no assurance they will prove to have been correct. Such expectations and forecasts can be affected by inaccurate assumptions or by known or unknown risks and uncertainties. New factors emerge from time to time and it is not possible for management to predict all such factors and to assess in advance the impact of such factor on Manitok's business or the extent to which any factor, or combination of factors, may cause actual results that differ from those contained in any forward-looking information or statements. All of the forward-looking information and statements contained in this presentation are qualified by these cautionary statements. The reader of this presentation is cautioned not to place undue reliance on any forward-looking information and statements. Manitok expressly disclaims any intention or obligation to update or revise any forward-looking information and statements, whether as a result of new information, events or otherwise, except in accordance with applicable securities laws.
Reader Advisory
2
Forward-looking Statements (Continued) Accredited Investor This is not an offer to sell or a solicitation of an offer to purchase securities by Manitok. In Canada, this presentation and its contents are directed only at "accredited investors" (as defined in National Instrument 45-106 Prospectus and Registration Exemptions). In the United States, any such offer or solicitation will only be made to "qualified institutional buyers" (as defined in Rule 144A of the United States Securities Act of 1933, as amended ("U.S. Securities Act")) or to "accredited investors" (as defined in Rule 501(a) of Regulation D under the Securities Act of 1933). By agreeing to receive this presentation, you represent and warrant that you are a person who falls within one of the foregoing descriptions of persons entitled to receive this presentation and that you agree to be bound by the provisions of this disclaimer. Any subsequent offer to sell or solicitation of an offer to purchase securities by Manitok will be made by means of offering documents (e.g., term sheet, prospectus, offering memorandum, subscription agreement and or similar documents (collectively, the "Offering Documents")) prepared by Manitok for use in connection with such subsequent offer or solicitation and only in jurisdictions where permitted by law. In the event of a subsequent offer to sell or solicitation of an offer to purchase securities by Manitok, investors should refer to the Offering Documents for more complete information, including investment risks, management fees and fund expenses. Non-Solicitation The attached material is provided for informational purposes only as of the date hereof, is not complete, and may not contain certain material information about Manitok, including important disclosures and risk factors associated with an investment in Manitok. This information does not take into account the particular investment objectives or financial circumstances of any specific person who may receive it. In the event of a subsequent offer to sell or a solicitation of an offer to purchase securities by Manitok, more complete disclosures and the terms and conditions relating to a particular investment will be contained in the Offering Documents prepared for such offer or solicitation. Before making any investment, prospective investors should thoroughly and carefully review the Offering Documents with their financial, legal and tax advisors to determine whether an investment is suitable for them. Neither Manitok nor any of its directors, officers, employees, agents or advisors makes any representation or warranty in respect of the contents of this presentation or otherwise in relation to Manitok or its business. In particular, no representation or warranty, express or implied, is made as to the fairness, accuracy or completeness of the information or opinions contained herein, which have not been independently verified. No person shall have any right of action (except in case of fraud) against Manitok or any other person in relation to the accuracy or completeness of the information contained in this presentation. The information contained in this presentation is provided as at the date hereof and is subject to amendment, revision and updating in any way without notice or liability to any party. This document and its contents are confidential. It is being supplied to you solely for your information and may not be reproduced or forwarded to any other person or published (in whole or in part) for any purpose. Certain information contained herein has been prepared by third-party sources. Such information has not been independently audited or verified by Manitok. Manitok has used its best efforts to ensure the accuracy and completeness of the information presented. BOE Conversions The term barrels of oil equivalent ("boe"), as used in this presentation, may be misleading, particularly if used in isolation. Per boe amounts have been calculated using a conversion ratio
and does not represent a value equivalency at the wellhead.
Reader Advisory
3
4
Trading Symbols - TSXV: MEI, MEI.WT, MEI.DB and US OTC: MKRYF
Average Q1 2017 production at 6,300 boe/d (37% oil and NGLs), a 43% year over year increase from Q1 2016;
1,200 boe/d of initial production depending on the results of the last 2 well completions; Total Proved reserves growth of 71% at year-end;
ratio of greater than 2.0x has been successful in achieving both production and reserves growth; Stock undervalued at $0.10 per share with Proved Plus Probable Net Asset Value of about $0.70/share;
Hedging in place for protection but also maintaining upside appreciation potential;
remainder of 2017;
5
Successful achievements demonstrate Management’s operating expertise in challenging times.
completion results pending on last 2 wells drilled;
Trading Symbols - TSXV: MEI, MEI.WT, MEI.DB and US OTC: MKRYF
Calgary Edmonton Wildcat Hills / Ricinus SE Alberta Stolberg / Willesden Green Carseland Wayne Rockyford
(1) Includes bank debt plus long term debt of $21.2 million CEL Notes (MEI.DB: 5 yr. term, 10.5% coupon) and $15.0 million of 8-year term (~6.7 yrs. remaining) facilities‘ financing.
Common Shares Outstanding 319,716,343 Insider Ownership (Basic / Fully Diluted) 5.8% / 10% Options (Wgt. Avg. exercise price of $0.16) 21,399,100 Warrants (Wgt. Avg. exercise price of $0.205) 46,322,608 Anticipated Bank Revolving Credit Facility ($41 million credit facility) ~$38 million AnticipatedTotal Short and Long Term Debt (1) ~$74.2 million Market Capitalization at $0.10/share ~$32.0 million Enterprise Value ~$106.2 million Production – Avg. Q1 2017 ~6,300 boe/d (38% Oil) Enterprise Value per Flowing boe ~$16,900 Proved plus Probable (2P) Reserves
(Sproule Report December 31, 2016)
28,154 Mboe (33% Oil) Enterprise Value per 2P reserves boe $3.77 / boe Reserve Life Index
(Proved plus Probable)
~13.0 years Gross Total Land
(74.4% Avg. Working Interest)
~680,000 acres Gross Undeveloped Land
(81.0% Avg. Working Interest)
~415,000 acres 6
Trading Symbols - TSXV: MEI, MEI.WT, MEI.DB and US OTC: MKRYF
Given Manitok’s oil weighting, value should be closer to $30,000 to $35,000 per flowing boe to reflect the value of the assets or 36 to 46 cents per share.
Board of Directors
Bruno Geremia, CA
VP Finance & CFO , Birchcliff Energy (BIR – TSX)
Massimo Geremia
President & CEO , Manitok Energy (MEI – TSXV)
Keith McLeod, P .Eng.
Former Director, Partner, and CEO of Sproule Associates Ltd.
Dennis Nerland, Q.C
Partner, Shea Nerland Calnan LLP; Director of Crew Energy Inc. (CR-TSX) Partner, Gowlings Canada Independent Businessman in Calgary.
7
Former COO ,, Manitok Energy Inc. (MEI – TSXV), previously Cdn. Upstream Division President with Provident Energy Trust
T
Cameron V
.Eng. Greg Peterson, LL.B. Ken Mullen, CPA, LL.B.
Former Director and President & CEO of Savanna Energy Services Corp.
Experienced Management Team
Massimo Geremia President & CEO 27 years of public company experience in Oil and Gas, Real Estate and Finance; previously with Birchcliff Energy Ltd., Equatorial Energy Inc. & Boardwalk Equities Inc. Over 16 years experience in the oil and gas industry. Robert Dion, C.A. VP Finance & CFO 25 years of industry experience in senior financial positions at Canadian Natural Resources Ltd., Rio Alto Exploration Ltd. and Nexen Inc. Tim Jerhoff, P . Eng. VP Production and Engineering Over 25 years of experience with Encana, Provident Energy Trust and Richland Petroleum; most recent role was as Manager, Clearwater South Production at Encana where he was responsible for 30,000 boe/d and an annual capital program of over $100 million. Don Martin, P. Geol VP Exploration Over 30 years of progressive geoscience experience; previously with Evergreen Resources, Marathon Canada, Anderson Exploration and Pan Canadian Petroleum. Greg Vavra, LL.B. Executive VP, Business Development 25 years of public companyexperience; previously President & CEO of Raimount Energy and VP of Pacific Cassiar Ltd.
8
Rodger Perry, P . Land VP Land Over 35 years of industry experience; formerly VP Cdn Operations with South Bay Resources Canada and other executive positions with several junior oil and gas companies.
Corporate Reserves (1) (Gross Before Royalties) 9
Total Proved Reserves Up Over 190% on a BOE basis from December 2014
Summary of Oil and Natural Gas Reserves as at December 31, 2016 (1)(2)(3)
Crude Oil Natural Gas Natural Gas Liquids Total Net Present Value (000’s) Net Present Value (000’s) Reserve Category Gross (Mbbls) Gross (Mmcf) Gross (Mbbls) Gross (Mboe) Dec 31/2016 (10%) April 30/2017 (10%) Proved Developed Producing 2,733.5 34,437 1,197.7 9,670.7 114,872 108,800 Developed Non-Producing 488.0 6,791 381.4 2,001.2 20,899 19,500 Undeveloped 1,986.5 15,400 782.7 5,335.8 52,549 49,100 Total Proved 5,207.9 56,627 2,361.9 17,007.7 188,320 177,400 Probable 3,052.9 39,259 1,550.3 11,146.3 111,459 107,400 Total Proved Plus Probable 8,260.6 95,887 3,912.2 28,154.0 299,780 284,800
(1) Based on Sproule's December 31, 2016 and April 30, 2017 forecast prices and costs and values before income taxes. The forecast of commodity prices used can be found in the appendix and at www.sproule.com. (2) Columns may not add due to rounding of individual items.
0% 20% 40% 60%
RMP Energy Inc. Gear Energy Ltd. Yangarra Resources Ltd. Perpetual Energy Inc. Strategic Oil & Gas Ltd. Cequence Energy Ltd. Chinook Energy Inc. Manitok Energy Inc. Zargon Oil & Gas Ltd Delphi Energy Corp. Traverse Energy Ltd.
EV Growth vs. Production Growth
2014 YE Production - 2016 Q3 Production 2014 YE EV - Present EV
EV Growth Production Growth
*Source - Capital IQ, Internal Estimates
10
Share Price will Catch up to Growth!
If EV growth matches production growth, Manitok shares should trade closer to 60 cents per share. One of few in the peer group to grow production during the 2 year period. No value given to Manitok in the market for performance.
Manitok Oil Plays have Top Tier IRRs at Current Oil Prices
11
(1) 30 day initial production rates and EUR were derived by Manitok Management using its information and public data. Assumes fixed oil prices, a fixed natural gas price of AECO $2.70/mmbtu, and a USD/CAD exchange ratio of 1.343. Assumes Manitok Management estimates of drilling costs as described on other pages of this presentation.
Manitok Play Type Sensitivity to Oil Price
125% 240%
0%
83% 145% 132% 67%
30% 60% 90% 120% 150% 180% 210% $35.00 $40.00 $45.00 $50.00 $55.00
WTI ($US / bbl)
$60.00 $65.00 $70.00
Rate Of Return (%)
57% 35% 21% 35% 58% 88%
Carseland LG Wayne LG Stolberg Cardium Basal Quartz Willesden Green Cardium
233% 112%
Infrastructure Acquisitions Will Lower Operating Costs and Increase Development Pace
12
1st yr.. Operating Netback / boe $20.08 1st yr. Operating Cost / boe $6.27 Half Cycle Capital cost / boe $ 4.07 Total Hz Cost (D, C & E) $1.7 MM 30 Day IP Rate (40% - 39° API oil) (1) 425 boe/d EUR (40% oil) (1) 415 Mboe BT NPV10 $4.1 MM BT IRR (1) 239% Recycle Ratio / Payout 4.9x / 0.7 yr.
(1) 30 day initial production rates and EUR were derived by Manitok Management using its information and public data. Assumes 5 year strip pricing as of April 28, 2017 (see appendix) with a 2% annual price escalation after the 5 years.
Carseland Lithic Glauc Oil - Hz Well Economics
Carseland Lithic Glauc Oil Highlights
100% working interest and operator; Q4 Drilling Program, utilizing Monobore drilling, achieved 55 - 60% lower costs per meter drilled than in 2014; Gas plant ownership, and upgrade to NGLs handling, has reduced processing costs from over $1.00/mcf to below $0.50/mcf and increased realized liquids yield from 10 bbl/mmcf to 28 bbl/mmcf. Q1 2017 Carseland acquisition
the base of the Belly River formation complete with full 3D seismic coverage;
systems extending over 3.5 townships; 5 already drilled horizontal wells to be tied in during the 3rd quarter; Management believes the wells combined will contribute between 1.000 and 1,200 boe/d of initial production depending
Wayne Lithic Glauc Oil Play
Manitok operated 1-20 Wayne oil battery with gas processing facility; 100% working interest; First HZ well test successful; 3D seismic and well control confirm over 50 nearby drilling locations; Development plan to upgrade refrigeration capacity at Wayne gas plant for full scale development which will decrease operating costs at Wayne significantly, as it did in Carseland. 15-19-28-21W4 well was drilled to a total measured depth of 3206m (lateral length of 1734m) in 7 days for ~$750,000 and completed for $650,000; The well tested at 366 boe/d.
Wayne Infrastructure Key to Lower Operating and Capital Costs
13
W ayne Lithic Glauc Oil - Hz Well Economics
(1) 30 day initial production rates and EUR were derived by Manitok Management using its information and public data. Assumes 5 year strip pricing as of April 28, 2017 (see appendix) with a 2% annual price escalation after the 5 years.
1st yr. Operating Netback / boe $20.70 1st yr. Operating Cost / boe $8.47 Half Cycle Capital cost / boe $ 7.98 Total LG Hz Cost (D, C & E) $1.7 MM 30 Day IP Rate (57% - 39° API oil) (1) 290 boe/d EUR (57% oil) (1) 213 Mboe BT NPV10 $1.5 MM BT IRR (1) 90% Recycle Ratio / Payout 2.6x / 1.1 yr.
Increased Assets in Cardium Oil Play in both Willesden Green and Stolberg in 2016
14
Manitok West Central Alberta
▪ Operator at Stolberg and Willesden Green; ▪ Over 40 net horizontal Cardium
▪ High working interest; ▪ 125,500 gross (76,700 net) acres
Willesden Green Gilby Ferrier
Land Holders MEI CQ Energy
Bellatrix Husky Bonavista Penn West Cdn Nat TAQA Conoco Whitecap
Manitok Oil Battery 01-32-42-9W5 Capacity 2,500 bbls/d Pembina Baptiste Oil Terminal
Willesden Green Cardium Oil Field Magnified Pembina Stolberg
▪ 2,500 bbl/d oil facility which is pipeline connected to a Pembina oil terminal; 11 Mmcf/d gas compression facility; ▪ Third party revenue from both oil and gas facilities. 1st yr. Operating Netback/boe $ 37.88 1st yr. Operating Cost/boe $ 5.96 Half Cycle Capital cost/boe $ 6.10 Total Hz Cost (D, C & E, $millions) $1.5 30 Day IP Rate (boe/d) 275 EUR (Mboe) 240 BT NPV10 (risked, $millions) $1.1 BT IRR (risked) (1) 65 % Recycle Ratio / Payout 6.2x/1.6yr
Cardium Oil Hz Well Economics
(1) 30 day initial production rates and EUR were derived by Manitok Management using its information and public data. Assumes 5 year strip pricing as of April 28, 2017 (see appendix) with a 2% annual price escalation after the 5 years.
Stolberg Upside Increased Significantly with Q1 2016 Acquisition and Potential EOR Plan
15
T41 R14
Cardium future locations Notikewin future locations Falher future locations
Significant Cardium Oil Upside Going Forward_ ▪ Prolific Cardium oil trend extends to SE on newly acquired lands; based on 3D seismic and well control; ▪ EOR in Cardium F pool will increase oil reserves; ▪ Notikewin gas play very promising based on production;
Stolberg F Pool Stolberg N Pool To Husky Ram River Gas Plant
Future locations Pipeline Oil Battery Gas Compressor
1st yr. Operating Netback / boe $37.02 1st yr. Operating Cost / boe $11.87 Half Cycle Capital cost / boe $10.40 Total Hz Cost (D, C & E) $2.7 MM 30 Day IP Rate (80% oil) (1) 355 boe/d EUR (1) 260 Mboe BT NPV10 (risked) $3.4 MM BT IRR (risked) (1) 185% Recycle Ratio / Payout 3.6x / 0.7 yr.
(1) 30 day initial production rates and EUR were derived by Manitok Management using its information and public data. Assumes 5 year strip pricing as of April 28, 2017 (see appendix) with a 2% annual price escalation after the 5 years.
Cardium Oil - Hz Well Economics
Lands acquired in Q1 2016. 3D Seismic and well control suggest prolific Cardium oil trend extends further to SE.
16
Plays Number of Net Drilling Locations NPV 10% of Each Location(1) ($Millions) Risk Adjustment Total NPV 10% ($Millions) SOUTH EAST ALBERTA Carseland Lithic Glauc Oil 33 $ 4.1 90% $ 121.8 Carseland Post/Lower Glauc Oil 15 $ 2.0 90% $ 27.0 Wayne Lithic Glauc Oil 30 $ 1.5 90% $ 40.5 Basal Quartz Oil 30 $0.5 90% $ 13.5 WEST CENTRAL ALBERTA Stolberg Cardium Oil 15.4 $ 3.4 90% $ 47.1 Willesden Green Cardium Oil 24.75 $ 1.1 90% $ 24.5 Stolberg Notikewin/Fahler Gas 12 $ 5.3 90% $ 57.2 Wildcat Hills Cardium, Viking & Mannville Gas 22 $ 4.0 90% $ 79.2 Total Net Present Value of Drilling Inventory $ 410.8 Total Net Present Value of DI / Share ~$1.28 Current Share Price $ 0.10
(1) 30 day initial production rates and EUR were derived by Manitok Management using its historical information and public data.
Assumed 5 year strip pricing as of April 28, 2017 (see appendix) with a 2% annual price escalation after the 5 years.
Tremendous Drilling Value Even at Low Oil and Gas Prices
Diversified Asset Base with High Reserve Coverage
✓ Core areas are operated with high working interest (57% - 100%) and infrastructure ownership. ✓ 17.0 mmboe and 28.1 mmboe of 1P and 2P reserves. $188.3 mm and $299.8 mm in 1P and 2P PV10 pre-tax value1. ✓ $74.2 million of debt secured to $188 million of TP reserve value from 4 core areas, providing more than 2.0x proven reserve to debt coverage.
Capital Cost Reduction Driving Superior Well Economics
✓ Lithic Glauc oil well drilling & completions cost reduced from $3.3 million per well to $1.7 million per well. ✓ Monobore drilling plan significantly lowers well cost, relative to traditional drilling plan. ✓ Lower capital cost per well allows Manitok to spread risk over multiple wells and manage its capital-at-risk in order to preserve its balance sheet. ✓ About 150 light oil horizontal drilling locations positions company for organic growth.
Infrastructure in Core Areas Puts Manitok in Control
✓ Upgrade of Carseland gas plant provides additional capacity for up to 2,200 boe/d; production in the area increased from 550 boe/d in Q1 2016 to about ~1,900 boe/d in December 2016. ✓ Gas plant improves netback by increasing liquids recovery by 180%, to ~28 bbl/mmcf, and decreasing gas processing costs, by more than 50%, to below $0.50/mcf from over $1.00/mcf previously. ✓ Sets company on a runway for production and cash flow growth with infrastructure in place.
UNDERVALUED & Positioned for growth in 2017
✓ Common shares undervalued on many different valuation metrics. ✓ Infrastructure is in place to develop core areas at a faster pace. ✓ Focus on Light Oil Plays with strong economics at lower oil prices. ✓ Company positioned to capitalize on lower industry costs and improving commodity prices.
17
18
19
SPROULE ASSOCIATES LTD. SUMMARY OF PRICE FORECASTS, INFLATION and EXCHANGE RATES Light Crude Oil Natural Gas and Liquids Year 1 WTI Cushing Oklahoma $US/Bbl Canadian Light Sweet 40 API CAD$/Bbl Henry Hub Price $US/MMbtu AECO - C Spot CAD$/MMbt u Ethane Plant Gate CAD$/Bbl Edmonton Propane CAD$/Bbl Edmonton Butane CAD$/Bbl Edmonton Pentanes Plus CAD$/Bbl Exchange Rate $US/$Cdn 2017 12 mo. Est 55.00 65.58 3.50 3.29 9.11 20.76 47.60 67.95 0.780 2018 55.00 65.58 3.50 3.39 9.39 21.46 49.36 66.67 0.780 2019 65.00 74.51 3.50 3.27 9.06 27.06 55.49 75.61 0.780 2020 70.00 78.24 4.00 3.81 10.55 29.81 57.65 78.82 0.820 2021 73.00 82.45 4.08 4.00 11.08 31.58 60.12 82.35 0.850 2022 74.46 84.10 4.16 4.10 11.35 32.44 61.32 84.07 0.850 2023 75.95 85.78 4.24 4.19 11.62 33.31 62.55 85.82 0.850 2024 77.47 87.49 4.33 4.29 11.90 34.20 63.80 87.61 0.850 2025 79.02 89.24 4.42 4.40 12.18 35.12 65.07 89.43 0.850 2026 80.60 91.03 4.50 4.50 12.47 36.05 66.37 91.29 0.850 2027 82.21 92.85 4.59 4.61 12.76 36.99 67.70 93.19 0.850 Escalation Rate of 2.0% Thereafter 1.40 Deg API, 0.4% Sulphur
20
SPROULE ASSOCIATES LTD. SUMMARY OF PRICE FORECASTS, INFLATION and EXCHANGE RATES Light Crude Oil Natural Gas and Liquids Year 1 WTI Cushing Oklahoma $US/Bbl Canadian Light Sweet 40 API CAD$/Bbl Henry Hub Price $US/MMbtu AECO - C Spot CAD$/MMbt u Ethane Plant Gate CAD$/Bbl Edmonton Propane CAD$/Bbl Edmonton Butane CAD$/Bbl Edmonton Pentanes Plus CAD$/Bbl Exchange Rate $US/$Cdn 2017 12 mo. Est 55.00 65.58 3.50 3.44 9.52 22.74 47.60 67.95 0.780 2018 65.00 74.51 3.50 3.27 9.06 28.04 55.49 75.61 0.820 2019 70.00 78.24 3.50 3.22 8.92 30.64 57.65 78.82 0.850 2020 71.40 80.64 4.00 3.91 10.82 32.27 58.80 80.47 0.850 2021 72.83 82.25 4.08 4.00 11.08 33.95 59.98 82.15 0.850 2022 74.28 83.90 4.16 4.10 11.35 35.68 61.18 83.86 0.850 2023 75.77 85.58 4.24 4.19 11.62 37.46 62.40 85.61 0.850 2024 77.29 87.29 4.33 4.29 11.90 39.30 63.65 87.39 0.850 2025 78.83 89.03 4.42 4.40 12.18 41.19 64.92 89.21 0.850 2026 80.41 90.81 4.50 4.50 12.47 43.13 66.22 91.07 0.850 2027 82.02 92.63 4.59 4.61 12.76 45.14 67.54 92.96 0.850 Escalation Rate of 2.0% Thereafter 1.40 Deg API, 0.4% Sulphur
21
Created April 28, 2017 Mid-market as of close of business 28-Apr-17 AECO CAD/GJ NYMEX NG USD/MMBtu WTI USD/Bbl WTI CAD/Bbl CAD/USD CAL17 $2.805 $3.365 $49.88 $67.80 $1.359 CAL18 $2.651 $3.120 $50.30 $67.99 $1.352 CAL19 $2.426 $2.906 $50.07 $67.22 $1.342 CAL20 $2.498 $2.906 $50.38 $67.19 $1.334 CAL21 $2.565 $2.929 $51.14 $67.79 $1.326
DISCLAIMER : National Bank of Canada and its affiliates is acting solely in the capacity of an arm’s length contractual counterparty, and not as an adviser or fiduciary. Accordingly you should not regard transaction proposals or other written or oral communications from us as a recommendation or advice that a transaction is appropriate for you or meets your financial
the terms, have evaluated the risks and determined that the transaction is appropriate for you in all respects. You should consult appropriate financial and legal advisers before entering into the transaction. The attached material does not constitute an offer to enter into any transaction. Such material is believed by us to be reliable, but we make no representation as to its accuracy or completeness. This brief statement does not purport to describe all of the risks associated with financial transactions and should not be construed as advice to you. Weather updates comes from an independent service.