
SLIDE 1
TSXV & BVL:TK | OTCPK: TKRFF www.tinkaresources.com
Corporate Presentation January 2019 Disclaimer This presentation - - PowerPoint PPT Presentation
TSXV & BVL:TK | OTCPK: TKRFF www.tinkaresources.com Corporate Presentation January 2019 Disclaimer This presentation is not directed to, or intended for distribution to or use by, any person or entity that is a citizen or resident or
TSXV & BVL:TK | OTCPK: TKRFF www.tinkaresources.com
This presentation is not directed to, or intended for distribution to or use by, any person or entity that is a citizen or resident or located in any locality, state, country or other jurisdiction where such distribution, publication, availability or use would be contrary to law or regulation or which would require any registration or licensing within such jurisdiction. This presentation does not constitute or form a part
Tinka, nor shall it or any part of it form the basis of or be relied on in connection with any contract or commitment whatsoever. Certain information in this presentation contains forward-looking statements and forward-looking information within the meaning of applicable securities laws (collectively "forward-looking statements"). All statements, other than statements of historical fact are forward- looking statements. Forward-looking statements are based on the beliefs and expectations of Tinka as well as assumptions made by and information currently available to Tinka's management. Such statements reflect the current risks, uncertainties and assumptions related to certain factors including but not limited to, all costs varying significantly from estimates, production rates varying from estimates, changes in metal markets, changes in equity markets, availability and costs of financing needed in the future, equipment failure, unexpected geological conditions, imprecision in resource estimates or metal recoveries, ability to complete future drilling programs, drilling program results varying from expectations, delays in obtaining survey results, success of future development initiatives, the completion and implementation of a preliminary economic assessment, pre-feasibility or feasibility studies, competition, operating performance, environmental and safety risks, delays in obtaining or failure to obtain necessary permits and approvals from local authorities, community relations, timing and completion of any surface rights agreements, and other development and operating risks. Should any one or more of these risks or uncertainties materialize, or should any underlying assumptions prove incorrect, actual results may vary materially from those described herein. Although Tinka believes that assumptions inherent in the forward-looking statements are reasonable, forward-looking statements are not guarantees of future performance and accordingly undue reliance should not be put on such statements due to the inherent uncertainty therein. Except as may be required by applicable securities laws, Tinka disclaims any intent or obligation to update any forward-looking statement. The Mineral Resources disclosed in this company presentation have been estimated by Mrs. Dorota El Rassi, P.Eng., and Mr. David Ross, P.Geo., both employees of RPA and independent of Tinka. The Zinc/Tin Mineral Resources were publicly released on November 26, 2018, while the Silver Resources were released on Feb 26, 2015. By virtue of their education and relevant experience, Mrs. El Rassi and Mr. David Ross are "Qualified Persons" for the purpose of National Instrument 43-101. The Mineral Resources have been classified in accordance with CIM Definition Standards for Mineral Resources and Mineral Reserves (May, 2014). Readers are encouraged to read the Company’s technical report in their entirety. This presentation has been prepared, reviewed and verified by Dr. Graham Carman, Tinka’s President and CEO and a Fellow of the Australasian Institute of Mining and Metallurgy, a qualified person as defined by NI 43-101.
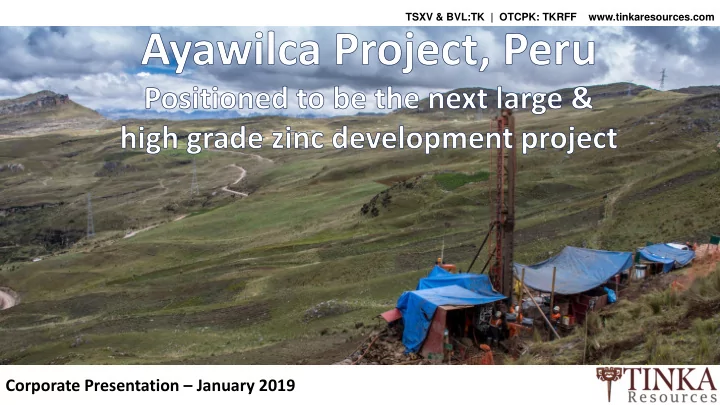
Ayawilca
Peru
* See resource tables for calculation of ZnEq and SnEq
Category/Area Tonnage (Mt) ZnEq (%) Zn (%) Pb (%) In (g/t) Ag (g/t) Zn (Mlb) Pb (Mlb) In (t) Ag (Moz) Indicated West 7.8 7.7 6.5 0.20 72 15 1,126 35 561 3.9 South 3.9 9.1 7.6 0.09 108 16 652 8 422 2.0 Total Indicated 11.7 8.1 6.9 0.16 84 15 1,778 42 983 5.8 Inferred West 5.0 7.1 6.4 0.27 34 17 699 30 170 2.8 Central 18.6 5.6 4.6 0.23 62 12 1,884 95 1,153 7.5 East 11.3 5.9 5.0 0.18 56 14 1,238 44 633 5.0 South 10.2 9.6 7.9 0.27 103 30 1,764 61 1,047 9.9 Total Inferred 45.0 6.7 5.6 0.23 67 17 5,585 230 3,003 25.2
Notes:
recoveries, assumed metal prices and smelter terms, which include payable factors, treatment charges, penalties, and refining charges. Metal price assumptions were: US$1.15/lb Zn, US$300/kg In, US$15/oz Ag, and US$1.00/lb Pb. Metal recovery assumptions were: 90% Zn, 75% In, 60% Ag, and 75% Pb. The NSR value for each block was calculated using the following NSR factors: US$15.34 per % Zn, US$4.70 per % Pb, US$0.18 per gram In, and US$0.22 per gram Ag.
NSR = [Zn(%)*US$15.34+Pb(%)*US$4.70+ In(g/t)*US$0.18+Ag(g/t)*US$0.22]
ZnEq = NSR/US$15.34
uncertainty as to their existence, and as to their economic and legal feasibility. It is reasonably expected that the majority of Inferred Mineral Resources could be upgraded to Indicated Mineral Resources with continued exploration. United States investors are cautioned not to assume that all
ever be converted into Mineral Reserves. United States investors are also cautioned not to assume that all or any part of an Inferred Mineral Resource exists, or is economically or legally mineable.
NSR US$/t Cut-off Tonnage (Mt) ZnEq (%) Zn (%) Pb (%) In (g/t) Ag (g/t) 40 13.6 7.4 6.3 0.16 75 15 50 12.4 7.9 6.7 0.17 80 15 55
(Base Case)
11.7 8.1 6.9 0.16 84 15 60 10.8 8.5 7.2 0.16 89 16 70 9.4 9.2 7.7 0.15 99 16 80 7.9 10.0 8.4 0.15 111 17 NSR US$/t Cut-off Tonnage (Mt) ZnEq (%) Zn (%) Pb (%) In (g/t) Ag (g/t) 40 52.7 6.2 5.2 0.24 60 17 50 48.1 6.5 5.4 0.24 64 17 55
(Base Case)
45.0 6.7 5.6 0.23 67 17 60 41.5 7.0 5.8 0.23 70 18 70 33.9 7.6 6.4 0.22 78 18 80 26.9 8.3 6.9 0.22 86 20
See resource table for notes and ZnEq calculations
500 m
Notes:
believed to be accurate
Measured & Indicated and Inferred resources. Vazante and Cerro Lindo data only reflects Reserves.
Fireweed-Tom&Jason NEXA-Aripuana Zinc X-Akie Rathdowney-Olza Trevali-Caribou Vendetta-Pegmont Trevali-Santander Foran-McIlvenna Bay NEXA-Vazante NEXA-Cerro Lindo NEXA-Shalipayco Tinka-Ayawilca2018 Tinka-Ayawilca2018+Tin
4.0 6.0 8.0 10.0 12.0 14.0
20 30 40 50 60 70 80 90
Global Resource/Reserve (Billons of pounds of Zinc Equivalent) Global Resource Size (Mt)
Zinc Equivalent Resource Size for Selected TSX/TSXV Companies
Producing mine Development project Ayawilca project - Zn Ayawilca project - Zn+Sn
Ayawilca – Zn +Pb only Ayawilca – ZnEq including tin
Source: Scotiabank
Galvanizing 50% Zinc Alloying 17% Brass and Bronze 17% Zinc Semi- Manufactures 6% Chemicals 6% Other 4%
Source: International Lead and Zinc Study Group (ILZSG)
Dr Graham Carman President & CEO, Director Geologist, 25 years global exploration experience with Rio Tinto, Savage, Pasminco, juniors Alvaro Fernandez- Baca VP Exploration, Peru Geologist, 20 years global exploration experience with Gitennes, AQM Copper & Hochschild. Ken Engquist Manager Project Development Engineer, 25 years project development experience with Arizona Mining, Nevsun, Rio Tinto, Oxygen Cap. Javier Escudero HSEC Manager, Peru Health, Safety, Environment, Community & Permits – Ex Goldfields, Rio Tinto, Antamina. Mariana Bermudez
20 years regulatory compliance services experience. Nick Demare CFO, Director CPA, CA, extensive junior board experience.
Ben McKeown Chairman of the Board. Mining engineer, MBA, with 25 years experience in mining,
Pieter Britz Sentient Group representative. Professional engineer with over 20 years’ experience as a mining professional and as a mining investment professional. Mary Little Founder of Mirasol Resources, geologist, MBA, 20 years in Latin America.
Mineral Rank in World 2016 Latin America 2016 Zinc 2nd 1st Copper 3rd 2nd Tin 6th 2nd Lead 4th 1st Silver 2nd 2nd Gold 6th 1st
Ayawilca Project
Las Bambas
Antamina
Central Peru zinc belt
CHILE BOLIVIA BRAZIL ECUADOR
San Rafael
Source: US Geological Survey
Giant Ore Deposit
Ayawilca Plan View with Geology
Ayawilca Long Section A-A’
Cross Section B-B’ Cross Section C-C’
10 20 30 40 50 60 2014 2015 2016 2017 2018 2019
Resources (Mt)
Ayawilca Resource Growth 2015 to 2018
Bubble size indicates contained zinc-equivalent pounds (Mlbs)
INFERRED INDICATED
Ayawilca Tin Zone Inferred Mineral Resources NSR US$/t Cut-off Tonnage (Mt) SnEq (%) Sn (%) Cu (%) Ag (g/t) 40 17.1 0.65 0.57 0.20 18 50 15.9 0.67 0.60 0.20 18 55
(Base Case)
14.5 0.70 0.63 0.21 18 60 12.5 0.76 0.68 0.22 17 70 10.1 0.84 0.76 0.23 18 80 8.3 0.92 0.84 0.25 19
Notes:
terms, which include payable factors, treatment charges, penalties, and refining charges. Metal price assumptions were: US$9.00/lb Sn, US$2.85/lb Cu, and US$15/oz Ag. Metal recovery assumptions were: 86% Sn, 75% Cu, and 60% Ag. The NSR value for each block was calculated using the following NSR factors: US$155.21 per % Sn, US$37.59 per % Cu, and US$0.22 per gram Ag.
US$NSR = [Sn(%)*US$155.21+Cu(%)*US$37.59+Ag(g/t)*US$0.22
economic and legal feasibility. It is reasonably expected that the majority of Inferred Mineral Resources could be upgraded to Indicated Mineral Resources with continued exploration. United States investors are cautioned not to assume that all or any part of Measured or Indicated Mineral Resources will ever be converted into Mineral Reserves. United States investors are also cautioned not to assume that all or any part of an Inferred Mineral Resource exists, or is economically or legally mineable.
$0.007/lb ZnEq $0.055/lb ZnEq
$- $0.010 $0.020 $0.030 $0.040 $0.050 $0.060 $0.070
Enterprise Value per ZnEq resource lb (bubble size = Enterprise Value)
Potential Uplift
Suite 1305 - 1090 West Georgia St Vancouver, BC V6E 3V7 CANADA Ph: +1 604 699-0202 Fax: +1 604 683-1585
info@tinkaresources.com
rbruggeman@tinkaresources.com +1 416 884-3556