
SLIDE 1
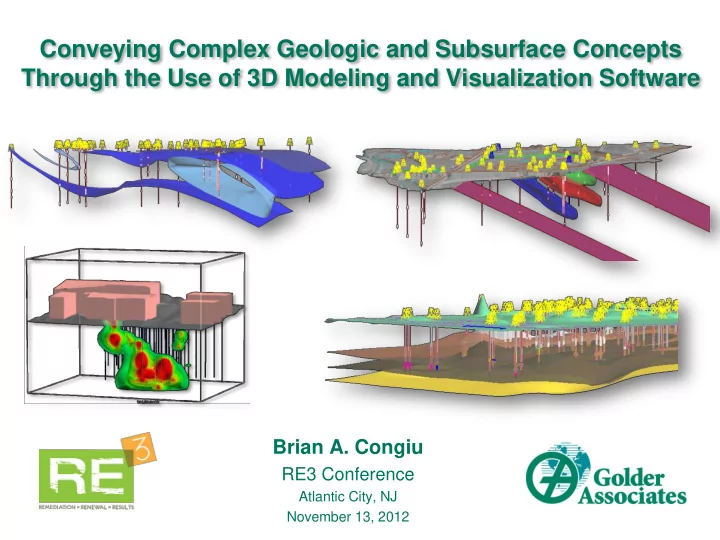
Conveying Complex Geologic and Subsurface Concepts Through the Use of 3D Modeling and Visualization Software
Brian A. Congiu
RE3 Conference
Atlantic City, NJ November 13, 2012
Conveying Complex Geologic and Subsurface Concepts Through the Use - - PowerPoint PPT Presentation
Conveying Complex Geologic and Subsurface Concepts Through the Use of 3D Modeling and Visualization Software Brian A. Congiu RE3 Conference Atlantic City, NJ November 13, 2012 Outline What is 3D Visualization? What Do We use It For?
RE3 Conference
Atlantic City, NJ November 13, 2012
December 4, 2012 2
October 17, 2011 3
December 4, 2012 4
5
regional references borehole logs cross-sections structural contours fractures/faults site mapping historical maps, photos, aerial images, sanborn maps, records, past operations
Hydrogeology
hydro testing water levels/contours regional references GW modeling
Chemistry
maps/ logs , testing results, cross-sections , surface/DH sampling results tables/graphs contours cross-sections 3D Model CSM site maps well locations utilities topography as-built drawings
December 4, 2012 6
Tradition al CSM 3D Model CSM Traditional CSM
December 4, 2012 8
December 4, 2012 9
December 4, 2012
December 4, 2012
December 4, 2012
December 4, 2012
December 4, 2012 15
December 4, 2012 16