
SLIDE 1
Contract 4625 Barry Baker, Katrina Jensz, Ross Cunningham Latitude - - PowerPoint PPT Presentation
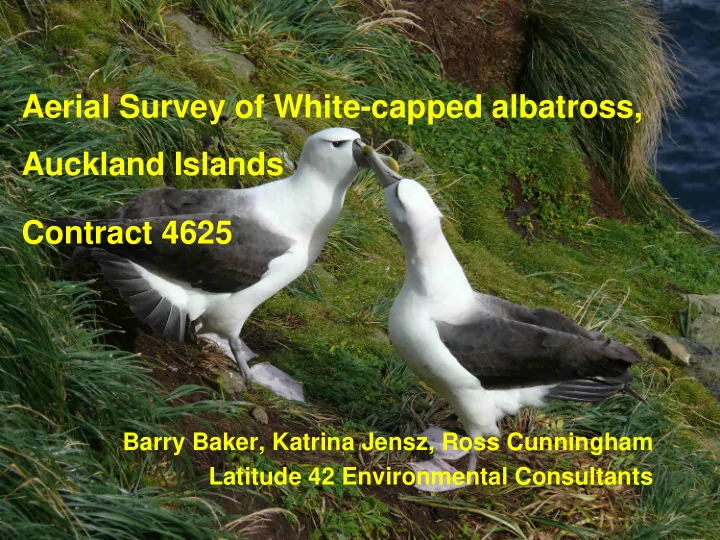
Aerial Survey of White-capped albatross, Auckland Islands Contract 4625 Barry Baker, Katrina Jensz, Ross Cunningham Latitude 42 Environmental Consultants background endemic NZ species Auckland Islands Disappointment Island (110 000
2
3
4
5
6
― these birds may be non-breeding birds or breeding birds away from their nest, birds that have laid an egg earlier in the breeding season & subsequently lost it through breakage or predation.
7
8
2006 no count
6,548 110,649 117,197
2007 79
4,786 86,080 90,945
2008 131
5,264 91,694 97,089
2009 132
4,161 70,569 74,862
2010 117
4,370 72,635 77,122
2011 178
5,846 93,752 99,776
2012 215
6,571 111,312 118,098
2013
184 5,542 89,552 95,278
2014 193
4,741 96,864 101,798
9
Year
2006 ? 2007 805
4 1%
2008 1 590
29 2%
2009 937
13
1% 2010 607
8 1%
2011 1 007
77 7%
2012 1 096
169 15%
2013 860 247 22% 2014 420 26 5.8%
10
11
Date Start End Bird sitting
Bird sitting
empty nest Total birds
nests Loafing - standing
nests Loafing birds, not associated with nests Total loafers Total birds Total Nests 6-Jan-15 NR NR 122 30 152 32 17 49 201 184 10-Jan-15 10:00 10:20 119 39 158 22 20 42 200 180 10-Jan-15 12:00 12:20 113 24 137 4 2 6 143 141 10-Jan-15 14:00 14:20 128 13 141 3 4 7 148 144 10-Jan-15 16:00 16:20 126 27 153 27 20 47 200 180 10-Jan-15 10:00 10:45 100 36 136 29 43 72 208 165 10-Jan-15 10:00 10:55 154 33 187 59 31 90 277 246 10-Jan-15 12:48 13:08 47 16 63 9 9 72 63 Totals 909 218 1,127 176 146 322 1,449 1,303 % 0.81 0.19 0.55 0.45 0.78 0.22 1.00
12
Interpretation: no evidence for monotonic decline
13
(TRends & Indices for Monitoring Data).
Pannekoek and van Strien, 1996
14
15
16
― series of overlapping photos of all areas with nesting birds (70 mm) ― close-up photos to examine proportion of empty nests & non-breeding birds (200 or 300 mm)
year saved as fine jpeg files No impact on birds detected
17
18